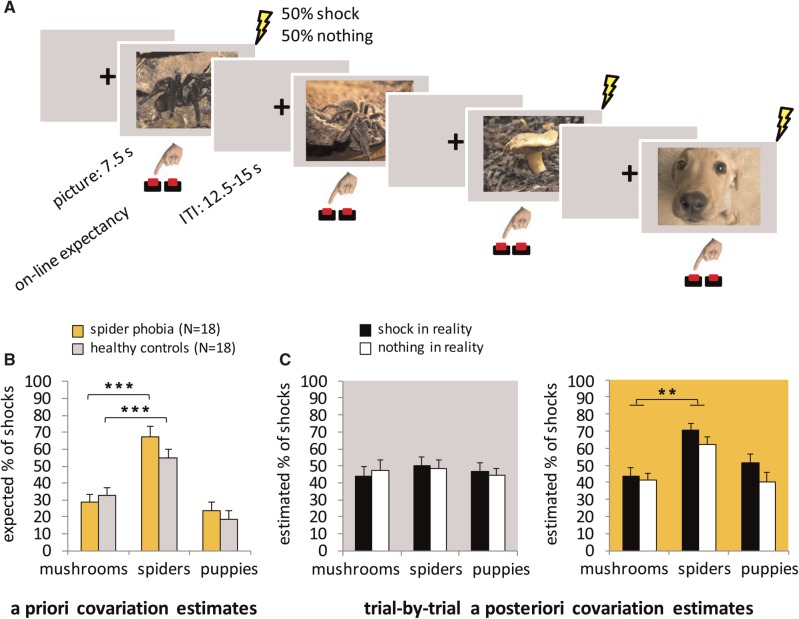
Fig. 1.
IC paradigm and covariation bias. (A) Three categories of pictures were presented (spiders, mushrooms and puppies). Exactly 50% of the pictures of each category were followed by a painful electrical shock. In order to keep attention focused on contingencies, participants were asked to press one of the two buttons depending on whether they expected a shock in a trial or not. The histograms show the expected proportion of shocks before (a priori, B) and the estimated proportion of shocks after the IC experiment (trial-by-trial a posteriori ICs, C). For trial-by-trial a posteriori ICs (C), each picture was presented again and the participants were asked to indicate whether a shock had followed that particular picture. Black and white bars display whether there had actually been presented a shock or nothing as an outcome. Both spider phobic and control participants expected more shocks following spiders before the experiment (B). Importantly, only spider-phobic participants (C, orange background) but not healthy controls (C, gray background) overestimated this association after the experiment. **P < 0.01; ***P < 0.001.

