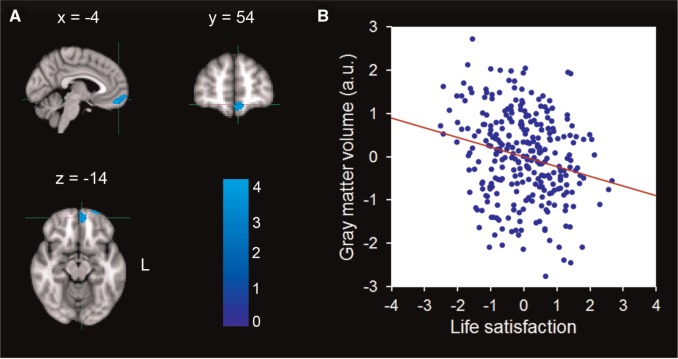
Fig. 2.
Brain regions that negatively correlated with life satisfaction. (A) The rGMV of the left VMPFC was negatively correlated with life satisfaction. The coordinate is shown in the MNI stereotactic space. (B) Scatter plots depicting correlations between rGMV of the VMPFC and individual variability in life satisfaction (r = −0.22, P < 0.001).

