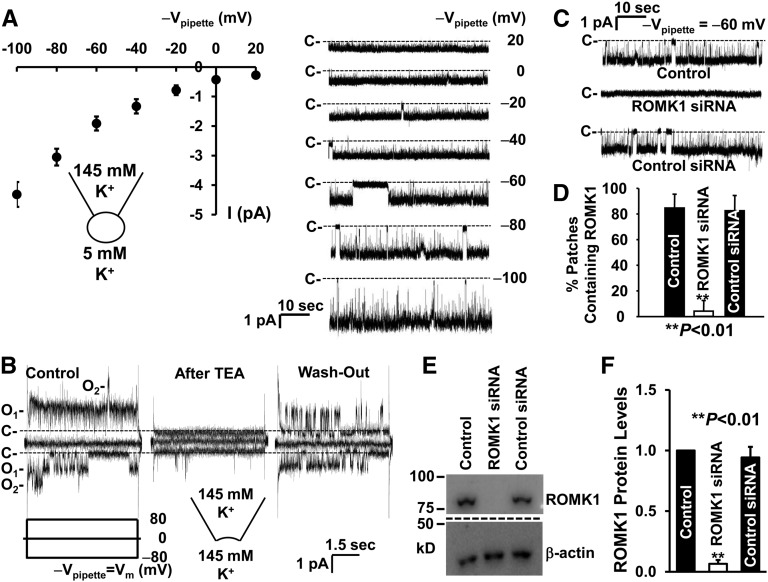
Figure 2.
ROMK1 channel is expressed in the apical membrane of mpkCCDc14 cells. (A, Left panel) Current-voltage relationship summarized from six cell-attached patches. (A, Right panel) Single-channel currents from a representative cell-attached patch versus the potentials applied to the patch pipette (Vpipette), which indicated by −Vpipette (millivolts). C- and dashed lines along with single-channel current traces show baselines where the channels are closed. (B) Channel activity in (left panel) an inside-out patch was blocked by 10 mM tetraethylammonium (TEA) applied to (center panel) the cytoplasmic bath, and (right panel) the blockade was reversed after washing TEA out of the bath. A voltage step protocol from −80 to 80 mV with 80-mV increments at a holding potential of 0 mV, as indicated by Vm (millivolts), was applied to the patch pipette. (C) Appearance of the channel in the patch was significantly reduced in the cells transfected with ROMK1 siRNA but not control siRNA. Downward events show inward currents through open channels. (D) Summary plots of percentages of patches containing ROMK1 channel activity in cell-attached patches formed on control cells (n=20) or cells transfected with either ROMK1 siRNA (n=18) or control siRNA (n=16). Data are from four separate experiments. (E) Western blot from control cells or cells transfected with either ROMK1 siRNA or control siRNA. β-actin in the same loading membrane was immunoprecipitated with antibody to β-actin and used to evaluate the amount of loaded protein. (F) Summary plots of relative ROMK1 protein levels from four separate Western blot experiments.

