Figure 5.
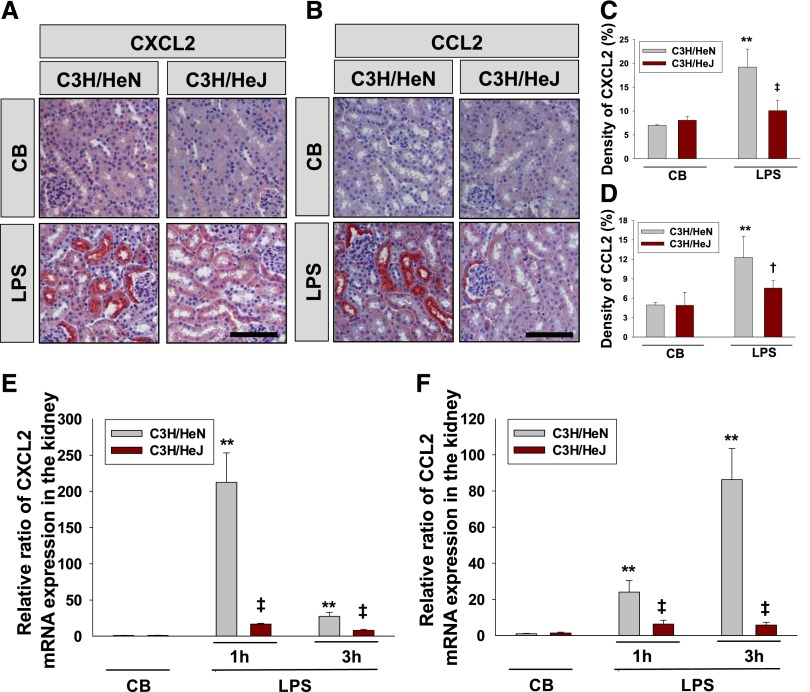
LPS-induced CXCL2 and CCL2 expression are decreased in the kidneys of C3H/HeJ mice. (A and B) Immunohistochemical study of CXCL2 (A) and CCL2 (B) in renal tissue of C3H/HeN (carrying wild-type TLR4) and C3H/HeJ (carrying mutated TLR4) mice after injection with LPS. Kidneys were harvested at 3 hours after intraperitoneal LPS injection. Tissues were fixed in 4% formaldehyde solution, and kidney sections were then stained with a CXCL2 or CCL2 antibody. Scale bar=100 µm. (C and D) Quantitative score of CXCL2 (C) or CCL2-positive (D) area in kidney sections. n=5 per group. (E and F) Analysis of CXCL2 (E) and CCL2 (F) mRNA expression by qRT-PCR in the kidney of C3H/HeN or C3H/HeJ mice at 1 and 3 hours after LPS or control buffer (CB) treatment. Fold changes of CXCL2 and CCL2 expression are relative to CB-treated kidney. Bars represent the mean±SD from six mice per group. The relative ratio measured in the CB-treated kidney of C3H/HeN mice is arbitrarily presented as 1. Bars represent the mean±SD. **P<0.01 versus CB-treated C3H/HeN mice; †P<0.05 versus LPS-treated C3H/HeN mice; ‡P<0.01 versus LPS-treated C3H/HeN mice.

