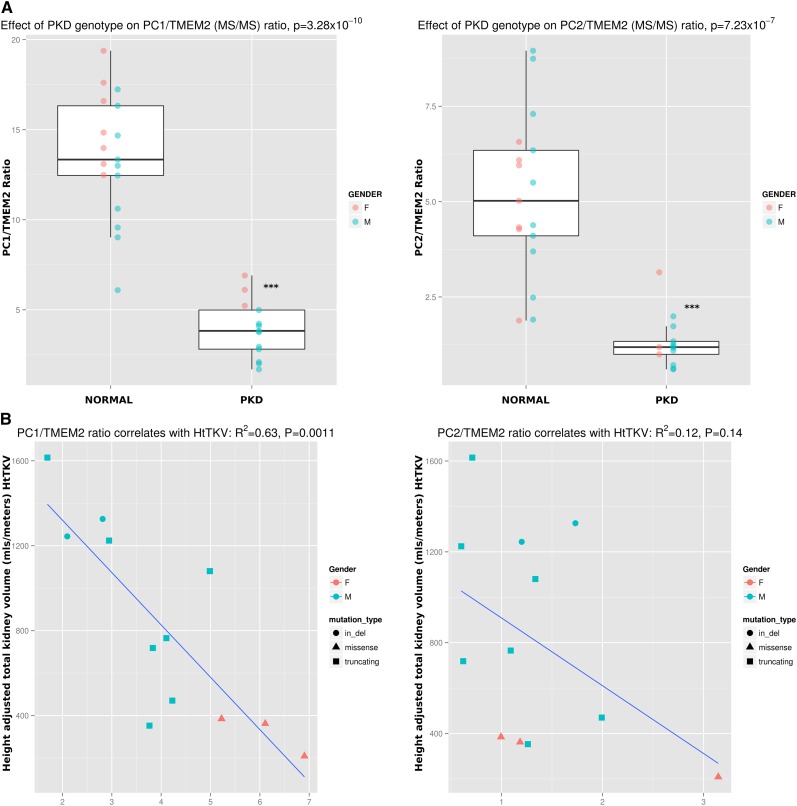
Figure 4.
Discovery MS/MS data show that PC1/TMEM2 and PC2/TMEM2 ratios are decreased in individuals with PKD1 mutations. (A) The ratios of PC1/TMEM2 and PC2/TMEM2 are decreased in individuals with PKD1 mutations, with P values of 3.3×10⁻¹⁰ and 7.2×10⁻⁷, respectively. Data are not obtained from gel slice B from one normal individual so n=17 for normal individuals. (B) The PC1/TMEM2 ratio correlates well with HtTKV (adjusted R2=0.63; P=0.001 for a linear model; Pearson correlation coefficient r=−0.81), whereas the PC2/TMEM2 ratio had an R2=0.12 (r=−0.45).

