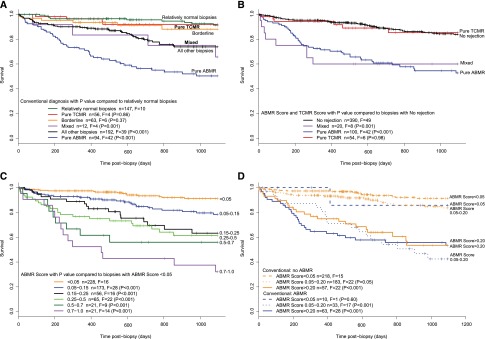
Figure 1.

Relationship of biopsy findings to subsequent graft survival. Kaplan–Meier curves for 3-year survival postbiopsy for 564 kidneys with one random biopsy per kidney and censoring death with function at 3 years (n is the total number of kidneys, F is failure, and vertical ticks indicate censoring). The total number of patients at risk at various times postbiopsy was 564 at day of biopsy, 498 at day 200, 435 at day 400, 342 at day 600, 273 at day 800, and 241 at day 1000. (A) Conventional diagnosis showing P values compared with relatively normal biopsies. (B) Molecular diagnosis split by ABMR and TCMR scores in pure ABMR (positive ABMR score and negative TCMR score), pure TCMR (positive TCMR score and negative ABMR score), and mixed (both positive). (C) Survival in groups divided by rising ABMR score. (D) ABMR score combined with the conventional diagnosis of ABMR/mixed versus no ABMR.
