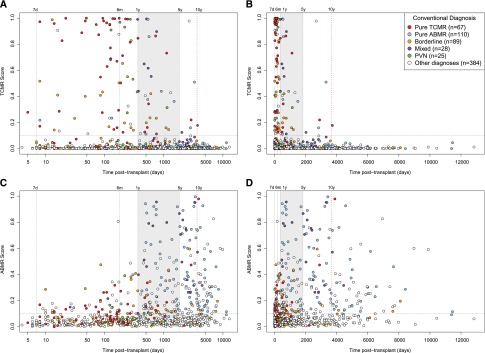
Figure 2.

Relationship between time of the biopsy post-transplant and biopsy findings. Distribution of TCMR and ABMR scores and conventional diagnoses in 703 biopsies by the time of the biopsy post-transplant. Each biopsy is represented by a symbol colored by conventional diagnosis. (A) TCMR scores on a log scale. (B) TCMR scores on a linear scale. (C) ABMR scores on a log scale. (D) ABMR scores on a linear scale. The intermediate time period (years 1–5) is shaded to separate early (first 1 year) from late (after 5 years). The time periods are further divided into intervals: early at day 7 and 6 months and late at 10 years.
