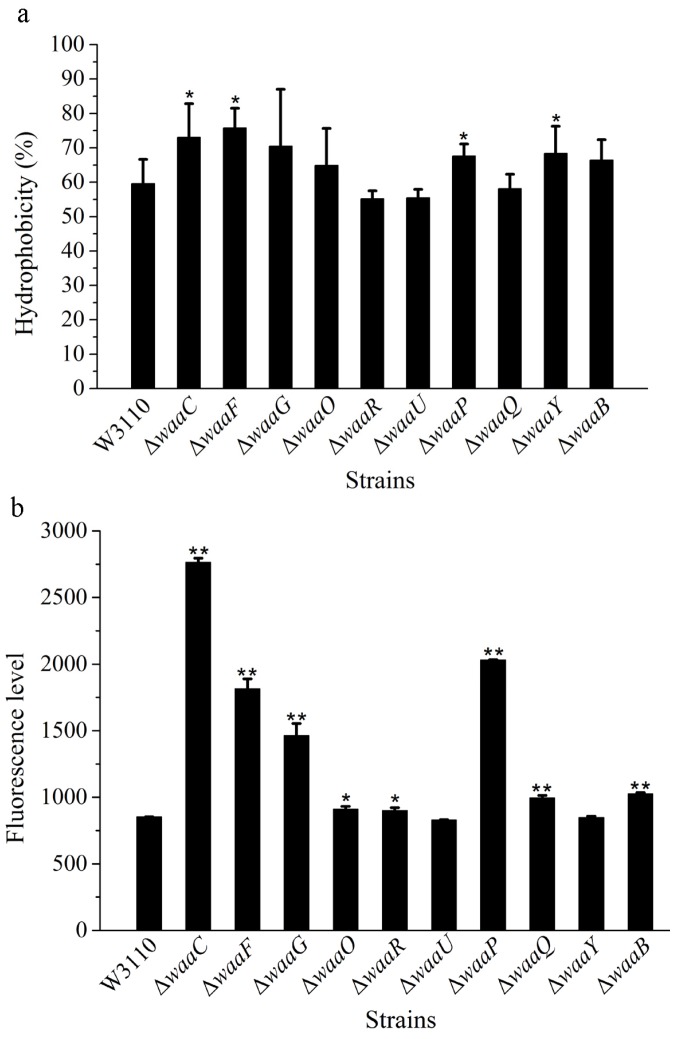
Figure 3.
Cell surface hydrophobicity (a) and outer membrane permeability (b) of LPS core OS mutants derived from W3110. The values represent the mean ± SD of results from three independent experiments. Statistical analysis was performed using ANOVA. ** P < 0.01 and * P < 0.05, against the control strain W3110.

