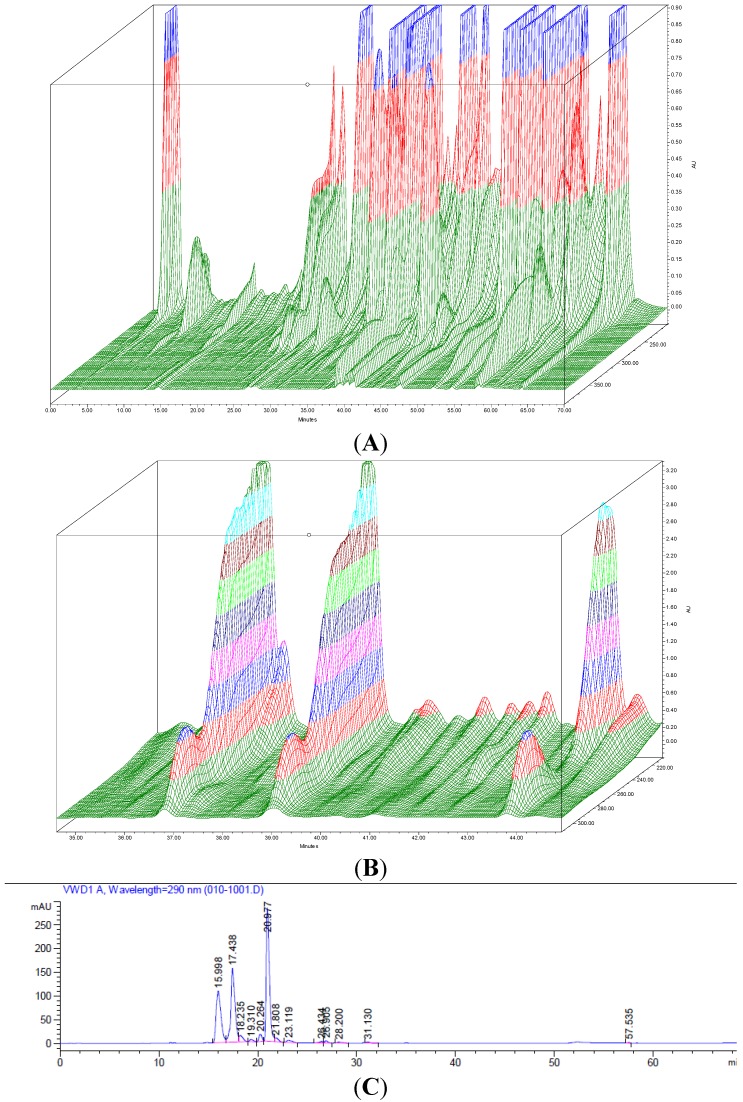
Figure 4.
(A) 3-dimensional absorbance scan (200–400 nm) using the Photo Diode Array detector (PDA) of extract E3 highlighting the chemical complexity of the extract; (B) Main portion of the 3-dimensional absorbance scan of active fraction 48, obtained following bioassay-guided fractionation using automated flash chromatography, showing the presence of 3 main compounds considered to represent the antimicrobial activity identified in the study, each with absorbance peaks at approximately 220 and 290 nm suggesting a similar class of compounds; (C) HPLC chromatogram (290 nm) of active fraction 47 displaying the elution pattern of the three compounds (green, white and red arrows) putatively responsible for the antimicrobial activity detected in fractions obtained previously through normal phase fractionation and tested using disc diffusion and TLC overlays.

