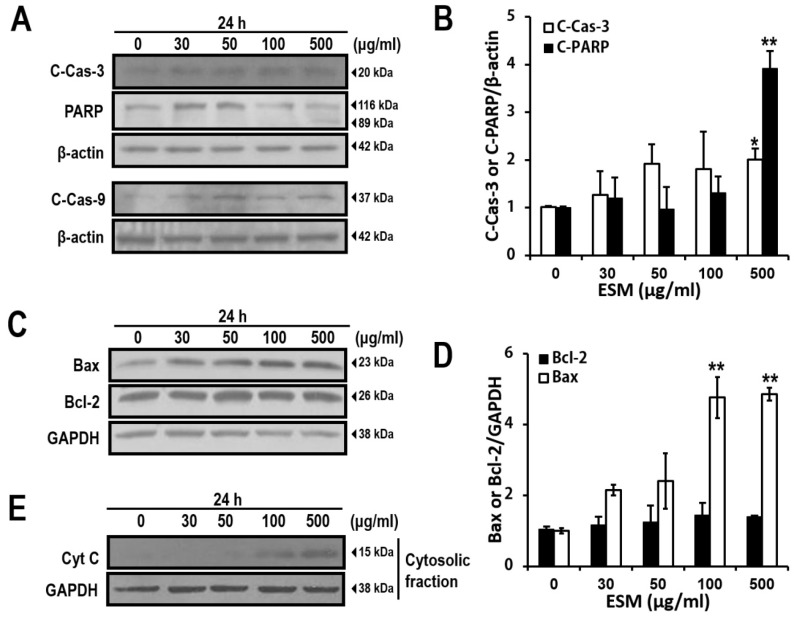
Figure 3.
ESM induces apoptosis signaling pathway in K562 cells. ESM-treated cells were analyzed by immunoblotting with antibodies against cleaved PARP (C-PARP, 89 kDa), full length PARP (116 kDa), cleaved caspase-3 (C-Cas-3) and cleaved caspase-9 (C-Cas-9). (A) Levels of Bax and Bcl-2 expression were then determined by immunoblotting analysis (C); The bar chart shows densitometric analysis of the indicated bands in A and C, respectively (B,D); Cytochrome C (Cyt C) in the cytosolic fractions was detected by immunoblotting (E). β-Actin and GAPDH were used as the internal controls. Data are presented as the mean ± SEM (n = 3). ** P <0.01 and * P < 0.05 compared with control.

