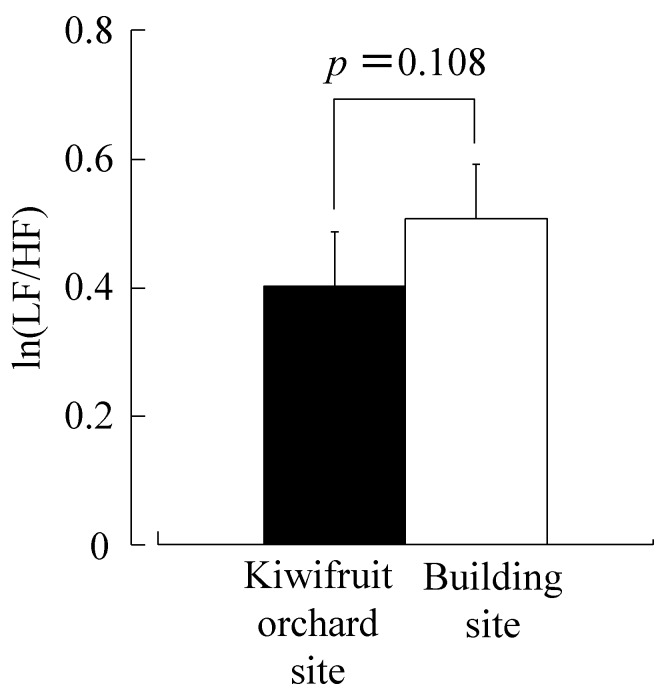
Figure 4.
Comparison of the natural logarithmic value of the low frequency (LF)/high frequency power ratio of heart rate variability during 10-min viewing of kiwifruit orchard or a building site. Date are expressed as the means ± standard error (SE); n = 17. p-value by the paired t-test (one-sided).

