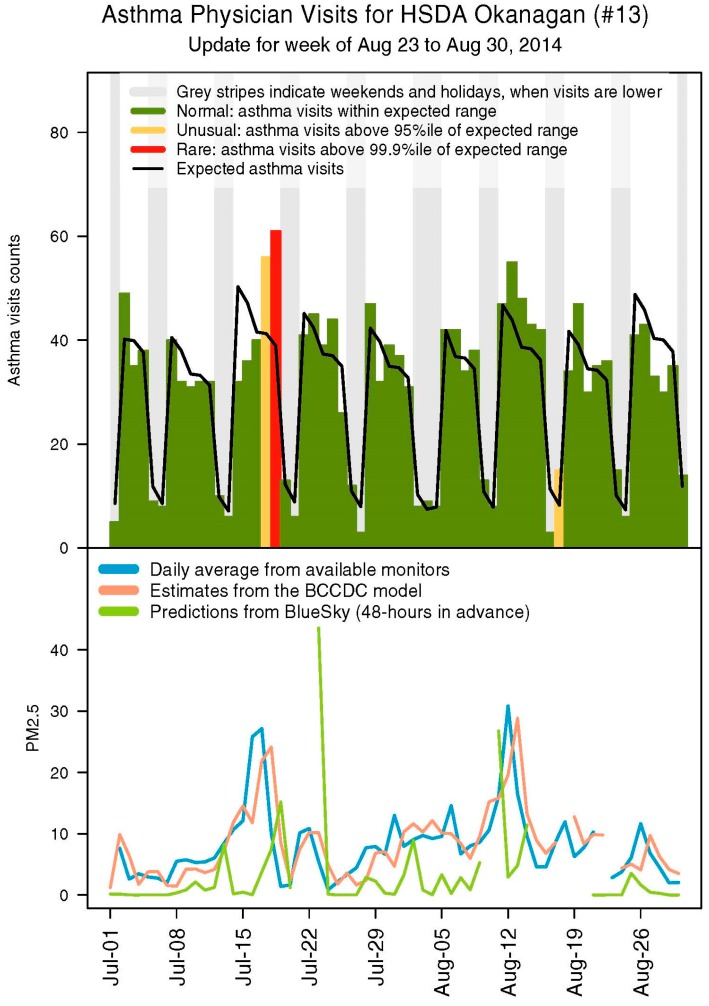
Figure 1.
Sample Health Service Delivery Area (HSDA) summary page from a 2014 BC Asthma Monitoring System (BCAMS) report on outpatient physician visits. The upper panel shows expected daily counts of an asthma indicator, based on data from June 2012 onwards, and observed counts with any excursions highlighted. An alerting algorithm was used to identify excursions from the expected values, where counts over the 95th percentile of the expected distribution were considered unusual, and counts over the 99.9th percentile of the expected distribution were rare. The lower panel shows the different PM2.5 metrics. The plot for BlueSky shows the prediction made 48 h previously for the current day.

