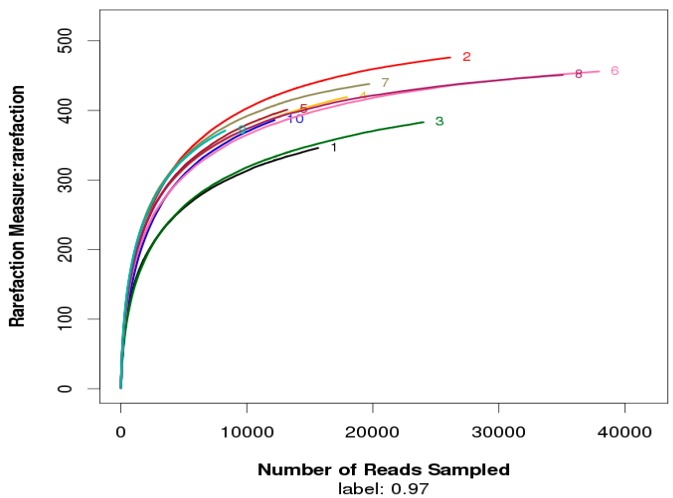
Figure 2.
Rarefaction curves of the operational taxonomic units (OTUs) number at 97% similarity boxplot for vertical distribution of bacterial community during JINPEN drinking water reservoir thermal stratification. 1, 2, 3, 4, 5, 6, 7, 8, 9, and 10 represent 0.5, 5, 10, 20, 25, 30, 45, 50, 55, and 65 m depths, respectively.

