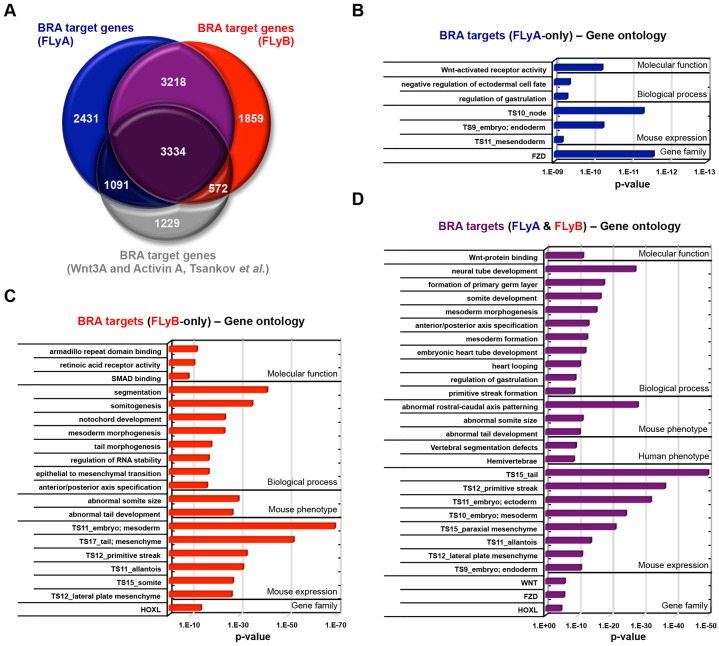
Fig. 3.
BRA has different sets of target genes in FLyA- and FLyB-treated hESCs. (A) Venn diagram showing the overlap of BRA putative target genes between FLyA-treated hESCs (blue), FLyB-treated hESCs (red) and WNT3A/activin- treated hESCs (grey; Tsankov et al., 2015). (B-D) Gene ontology analyses (GREAT algorithm; McLean et al., 2010) of BRA-binding regions detected only in FLyA (B), only in FLyB (C) and in both FLyA and FLyB (D). Ontology terms are ranked according to their enrichment P-values: ‘Gene family’ terms (P-value <1×10⁻⁵), all other terms (P-value <1×10⁻⁹). TS, Theiler stage of mouse development.

