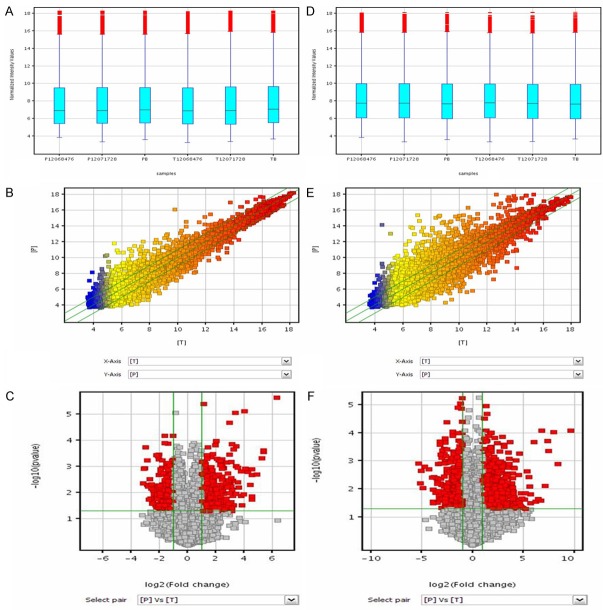
Figure 2.
Differences in LncRNA and mRNA expression profiles between HSCC tissues and adjacent nontumor tissues. A and D: Box plots. All 6 samples in the dataset were normalized. For both lncRNA and mRNA, the distributions of log2 ratios were nearly the same in all tested samples. B and E: Scatter plots. The values plotted on the X and Y axes are the averaged normalized signal values in each group (log2 scaled). The green lines indicate the fold change. The middle line indicates a fold change of 1, or no difference in expression between HSCC and adjacent nontumor tissue. The values above the top green line and below the bottom green line indicate more than 2.0-fold difference between HSCC and nontumor tissue samples. C and F: Volcano plots. Volcano plots show the relationship between magnitude of expression difference and statistical significance. They also allow subsets of genes to be isolated on the basis of those values. The vertical green lines correspond to 2.0-fold upregulation and 2.0-fold downregulation of expression, and the horizontal green line indicates a P value of 0.05. Thus, the red points in the plot represent lncRNAs with statistically significant differential expression.

