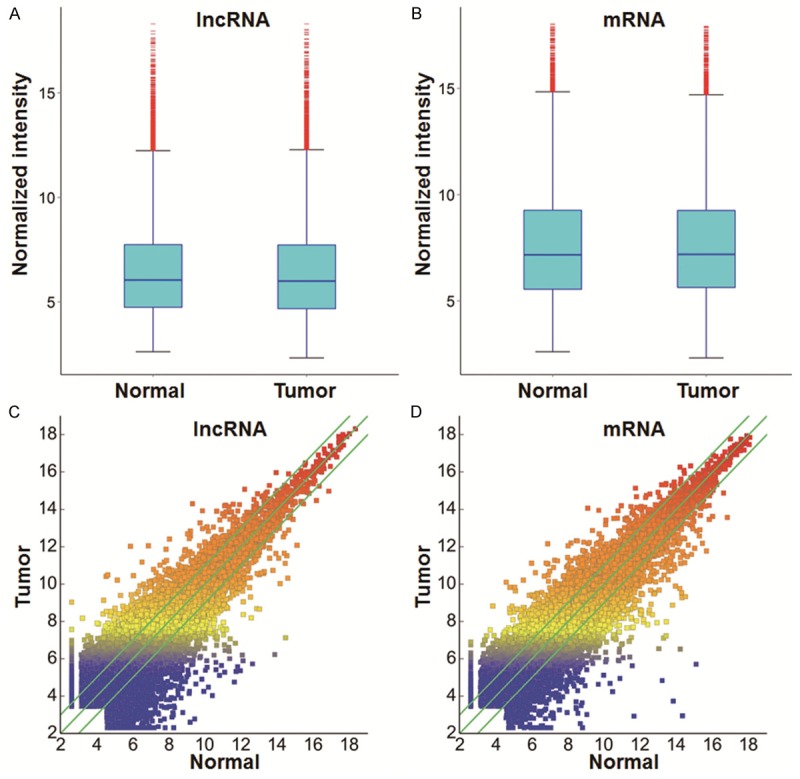
Figure 1.

Expression profiles of lncRNAs and mRNAs in EC and adjacent normal tissues. Box plots of (A) lncRNAs and (B) mRNAs showed the distributions of intensities from all samples. Scatter plots showed (C) lncRNA and (D) mRNA expression variation between EC and adjacent normal tissues. Values of X and Y axes in the scatter plots are normalized signal values of the samples (log2 scaled). The green lines are fold-change lines, with the default fold change value being 2.0. LncRNAs above the top green line and below the bottom green line had more than 2.0-fold changes between EC and adjacent normal tissues.
