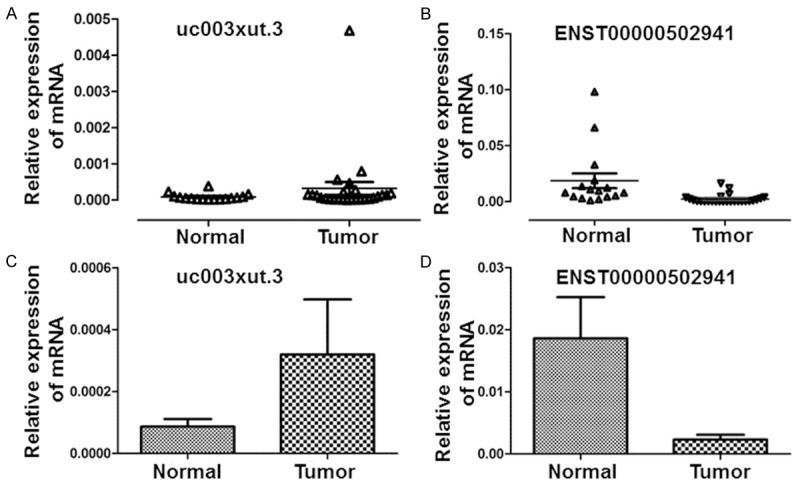
Figure 6.

Distribution of (A) uc003xut.3 and (B) ENST00000502941 in EC and normal tissue samples. Triangle symbols show the distribution of mRNAs. Expression levels of (C) uc003xut.3 and (D) ENST00000502941 in EC and normal tissue samples. Histograms show the average expression levels of mRNAs and error bars indicate standard deviations.
