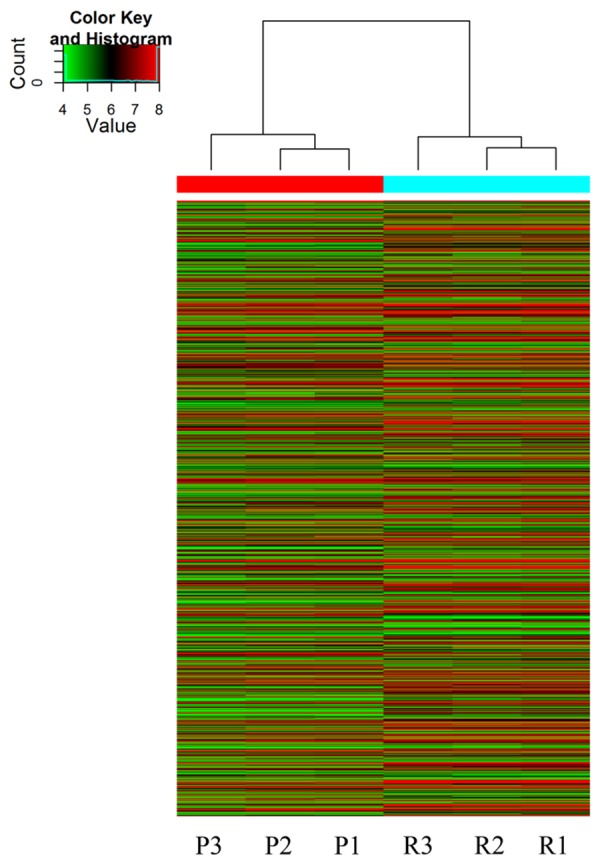
Figure 3.

Hierarchical Clustering of lncRNAs. The relationships among the expression levels of six samples are showed clearly by this dendrogram. “Red” indicates high relative expression and “green” indicates low relative expression. “P” indicates primary glioma and “R” indicates recurrent glioma.
