
Figure 2.
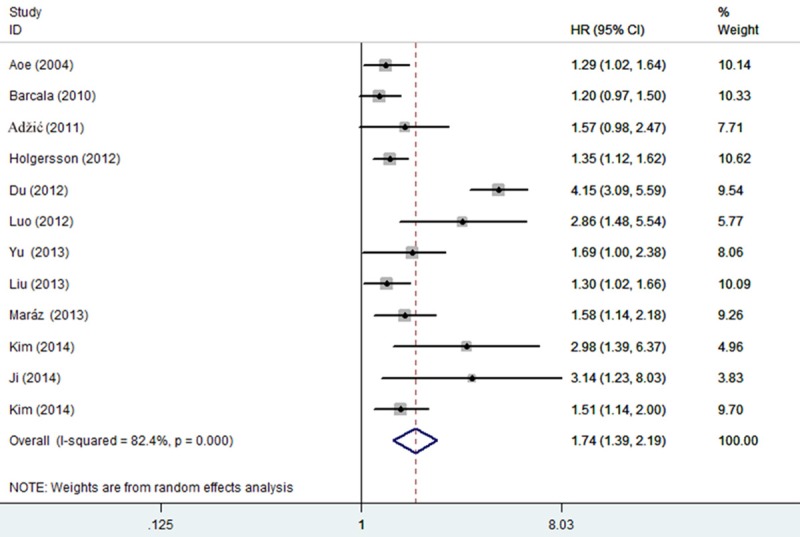
Forest plot of the association between high PLT and OS in LC. Each study was shown by the name of the first author and the HR with 95% CI arranged by publication year. The pooled HR and 95% CI were also presented (according to the random effects model).