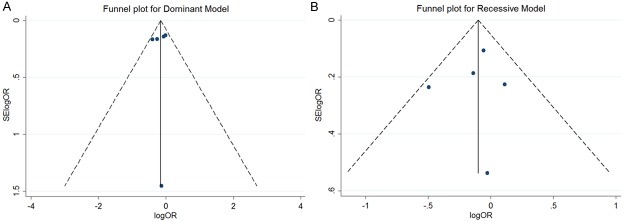
Figure 2.

Publication bias analysis for rs2075555. A and B show the Begg’s funnel plot of studies in the dominant and recessive models, respectively. The horizontal axis indicates the logOR and the vertical axis indicates the standard error of logOR (SElogOR). The vertical and sloping lines in the funnel plot demonstrate the fixed-effects summary OR, and the expected 95% CI for a given standard error, respectively.
