Abstract
Docosahexaenoic acid (DHA), a derivative of ω3- polyunsaturated fatty acids present in fish oil, is well known to have anticancer activity on colon cancer cells, but the molecular and cellular mechanisms remain to be further clarified. In this study, anti-cancer effects of DHA on colon cancer cells were observed in a nude mouse HCT-15 xenograft model. And then, the different genes expression and signal pathways involved in this process were screened and identified using cDNA microarray analysis. Results of genes expression profiles indicated a reprogramming pattern of previously known and unknown genes and transcription factors associated with the action of DHA on colon cancer cells. And several genes related to tumor growth and metastasis including COX2, HIF-1α, VEGF-A, COMP, MMP-1, MMP-9, SCP2, SDC3, which were down-regulated by DHA, were further confirmed in HCT-15 cell line using RT-PCR method. In summary, our data might provide novel information for anti-cancer mechanism of DHA in colon cancer model.
Keywords: DHA, colon cancer, microarray analysis, in vivo, nude mice
Introduction
The pathogenesis of colon cancer is a long and multifactorial process involved alterations in gene expression which are induced by nongenotoxic and epigenetic mechanisms [1]. Inflammation of bowel significantly increases the risk of developing malignancy in the colon [2].
Dietary omega-3 polyunsaturated fatty acids (ω3-PUFAs) contain more than one carbon double bond and have a variety of anti-inflammatory and immune-modulating effects. These ω3-PUFAs are able to regulate eicosanoid production [3], formation of lipid peroxidation products [4], genes transcription [5], Wnt/β-catenin signal pathway [6], and cell autophagy [7]. Epidemiological studies have showed that high intake of saturated fat increases the risk of colon cancer, and that diets rich in ω3-PUFAs reduce the risk of colon cancer development [8], and there is an inverse association of consumption of fish oil (ω3-PUFAs) with colon cancer.
Docosahexaenoic acid (DHA), a derivative of ω3-PUFAs, has been demonstrated to have beneficial effects on several autoimmune and inflammation disorders [9] and have anticancer properties both in vitro and in vivo [10]. DHA enriched diets can exert anti-inflammatory properties, thus suppressing colon cancer development [11]. Importantly, DHA is cytotoxic to tumor cells, with little or no effects on normal cells. However, the mechanism of how DHA suppresses tumor growth has not been firmly established.
In this study, we constructed a xenograft nude mouse model of colon cancer to investigate the effect of DHA on colon cancer growth in vivo. Furthermore, we explored the molecular mechanism of DHA inhibiting colon cancer progression using cDNA microarray analysis.
Materials and methods
Cell culture
Human colon cancer cell line HCT-15 was obtained from Shanghai Cell Bank (Shanghai, China). Cells were maintained in DMEM medium (Hyclone, Logan, Utah, USA) containing 10% FBS (Hyclone, Logan, Utah, USA) and cultured in a humidified 5% CO2 atmosphere at 37°C.
Tumor formation assay in a nude mouse model
Two-Three weeks old female BALB/c nude mice were obtained from Laboratory Animal Center of Soochow University (Suzhou, China) and maintained under specific pathogen-free conditions temperature (23-25°C) and humidity (40-50%). HCT-15 cells were harvested from subconfluent cell culture plates, washed with PBS and resuspended with physiological saline at a concentration of 1 × 10⁵ cells/µl. A 0.1 ml of HCT-15 suspended cells was subcutaneously injected into the right flank of each mouse aged 4 weeks. Mice were randomly assigned to two groups (12 mice for each group), one group mice were fed a 7.5% fish oil-based diet (Teklad Diets, Madison WI, high in DHA), and the other one were fed a 7.5% corn oil-based diet (no DHA) beginning three days prior to injection. After transplantation, the mouse weight and growth of the subcutaneous tumors were assessed every two days. Xenograft tumor size was monitored by measuring the width (W) and length (L) with callipers, and volumes were calculated with the formula: (W2 × L)/2. Eight weeks after injection, the mice were euthanized, and the volumes of subcutaneous tumors were recorded. The tumors will be dissected, sectioned and preserved in liquid nitrogen.
RNA isolation and microarray analysis
Total RNA from the tumors of each group was extracted by TRIzol (Invitrogen, California, USA). Double-stranded cDNA was synthesized from total RNA using the SuperScript Double-Stranded cDNA Synthesis Kit (Invitrogen, California, USA) according to the manufacturer’s instructions. cDNA was labeled overnight using the NimbleGen One-Color DNA Labeling Kit (Roche, Basel, Swiss) and washed with NimbleGen wash buffer kit. Hybridization was carried out by NimbleGen Hybridization System according to the manufacturer’s instructions. Microarray slides were scanned using an Axon GenePix 4000 B scanner (Axon Instruments, Foster City, CA, USA).
RT-PCR analysis
RT-PCR analysis was carried out using DHA-treated and untreated cDNA in HCT-15 cells. Amplification was performed over 28 cycles consisting of 95°C for 3 min, 57°C for 30 sec and 72°C for 30 sec. The sequences for primers were listed on the Table 1.
Table 1.
PCR primer sequences
| Genes | Primer sequences | Products (bp) |
|---|---|---|
| COX2 | F: 5’-AACATCTCAGACGCTCAGGAAATAG-3’ | 183 |
| R: 5’-GCCGTAGTCGGTGTACTCGTAG-3’ | ||
| HIF-1α | F: 5’-CACTGCACAGGCCACATTCA-3’ | 101 |
| R: 5’-GGTTCACAAATCAGCACCAAG-3’ | ||
| VEGF-A | F: 5’-AGGAGGGCAGAATCATCACGA-3’ | 134 |
| R: 5’-AGGATGGCTTGAAGATGTACTCG-3’ | ||
| COMP | F: 5’-GCCTTCAATGGCGTGGACTT-3’ | 116 |
| R: 5’-CACATGACCACGTAGAAGCTGG-3’> | ||
| MMP1 | F: 5’-GCACATGACTTTCCTGGAATTG-3’ | 159 |
| R: 5’-TTTCCTGCAGTTGAACCAGCTA-3’ | ||
| MMP9 | F: 5’-GAGGTGGACCGGATGTTCC-3’ | 168 |
| R: 5’-GCACTGCAGGATGTCATAGGTC-3’ | ||
| SCP2 | F: 5’-GTTTGAGAAGATGAGTAAGGGAAGC-3’ | 126 |
| R: 5’-ATCTGAGGAGCAACTGGGTGAG-3’ | ||
| SDC3 | F: 5’-TGCTCGTAGCTGTGATTGTGGG-3’ | 140 |
| R: 5’-GTATGTGACGCTCGCCTGCTT-3’ | ||
| GAPDH | F: 5’-GAAGGTGAAGGTCGGAGTC-3’ | 224 |
| R: 5’-GAAGATGGTGATGGGATTTC-3’ |
PCR products were separated by electrophoresis on a 2% agarose gel and visualized by ethidium bromide staining. The relative intensity of each band was normalized against the intensity of the GAPDH band amplified from the same sample.
Statistical analysis
Statistical analyses were calculated using SPSS 17.0. The results shown were the means ± SD. A. P-value < 0.05 was considered to indicate a statistically significant difference.
Results
DHA inhibits tumor growth in vivo
HCT-15 cells were subcutaneously injected into nude mice which were randomly assigned to two groups. The volumes of the tumors were recorded every two days, and xenograft tumors were harvested at the end of experiment. Tumor volumes from DHA treated mice were remarkably smaller than those from the control mice. Efficacy of DHA treatment became much significant with time (Figure 1, P < 0.05). Clearly, the in vivo results indicated that DHA could inhibit colon cancer cell growth.
Figure 1.
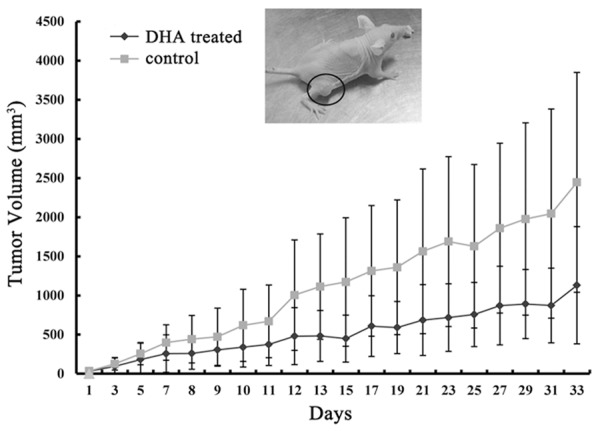
Fish oil diet suppresses colon tumor growth in nude mice. HCT-1 cells (1 × 10⁵ in 0.1 ml PBS) were injected into the right flank of each mouse aged 4 weeks. Tumor volume was calculated with the formula: (W2 × L)/2 and expressed as cubic millimeters.
DHA induced differential gene expression pattern in xenograft tumors
In this study, gene expression analysis was done for two group samples: DHA treated xenograft tumors and control group. Measurements on the intensities of the expressed genes were represented in Figure 2, as simple bivariate scatter plots comparing the profiles of DHA treated xenograft tumors to the vehicle-treated xenograft tumors. The X axis represented the control signal values and the Y axis meant DHA treated signal values. Changes in the gene expression pattern were observed as indicated by the shifts of the data points in the scatter plot. To obtain an overall gene expression pattern on a specific cluster of genes in DHA treated xenograft, an in-depth analysis of microarray data was carried out. As Table 2 showed (Top 20-fold), after treated with DHA, there was a total of 2073 differentially expression genes (fold change ≥ 2) including 967 up-regulated genes and 1106 down-regulated genes.
Figure 2.
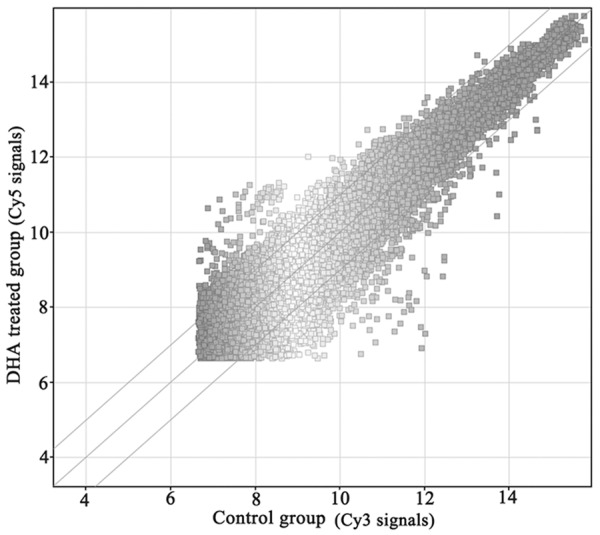
Scatter plot view of gene expression. Expression intensity Cy5: Cy3 ratios of DHA-treated versus untreated HCT-15 cells. The ratios (Cy-5: Cy-3) of genes that have 2-fold expression were considered up-regulated, and those with 0.5-fold expression were considered down-regulated. Approximately 2073 differentially expressed genes were detected in DHA treated.
Table 2.
Differentially expressed genes in colorectal tumors treated with DHA or not (Top 20-fold)
| Up-regulated genes | Fold | Chromosome | Gene description |
|---|---|---|---|
| MGP | 13.865016 | chr12 | matrix Gla protein |
| MGP | 13.296371 | chr12 | matrix Gla protein |
| IGKC | 11.253024 | chr2 | immunoglobulin kappa constant |
| IGKV1-5 | 10.592265 | chr2 | immunoglobulin kappa variable 1-5 |
| IGKC | 10.222312 | chr2 | immunoglobulin kappa constant |
| N/A | 10.1450815 | chr2 | Homo sapiens cDNA clone MGC: 40426 IMAGE: 5178085, complete cds. |
| LOC651928 | 9.441747 | chr2 | similar to Ig kappa chain V-II region RPMI 6410 precursor |
| N/A | 8.916328 | chr2 | Homo sapiens cDNA clone MGC: 12418 IMAGE: 3934658, complete cds. |
| IGKV1-5 | 8.710333 | chr2 | immunoglobulin kappa variable 1-5 |
| IGKV1-5 | 8.467994 | chr2 | immunoglobulin kappa variable 1-5 |
| AGC1 | 8.335031 | chr15 | aggrecan 1 (chondroitin sulfate proteoglycan 1, large aggregating proteoglycan, antigen identified by monoclonal antibody A0122) |
| IGKC | 7.951564 | chr2 | immunoglobulin kappa constant |
| N/A | 7.855886 | chr2 | Homo sapiens cDNA clone MGC: 23888 IMAGE: 4704496, complete cds. |
| AZGP1 | 7.7640123 | chr7 | alpha-2-glycoprotein 1, zinc |
| N/A | 7.670388 | chr2 | Homo sapiens cDNA clone MGC: 32764 IMAGE: 4618950, complete cds. |
| N/A | 7.6073294 | chr2 | Homo sapiens cDNA clone MGC: 27376 IMAGE: 4688477, complete cds. |
| C11orf43 | 7.5508437 | chr11 | chromosome 11 open reading frame 43 |
| IGKC | 7.5209823 | chr2 | immunoglobulin kappa constant |
| N/A | 7.502064 | chr2 | Homo sapiens cDNA clone MGC: 71990 IMAGE: 30353269, complete cds. |
| IGKC | 7.418584 | chr2 | immunoglobulin kappa constant |
| PDLIM3 | 31.80185 | chr4 | PDZ and LIM domain 3 |
| LOC391749 | 26.017834 | chr5 | similar to Transcription initiation factor TFIID subunit 11 (Transcription initiation factor TFIID 28 kDa subunit) (TAF(II)28) (TAFII-28) (TAFII28) (TFIID subunit p30-beta) |
| LOC402207 | 21.524765 | chr5 | similar to Transcription initiation factor TFIID subunit 11 (Transcription initiation factor TFIID 28 kDa subunit) (TAF(II)28) (TAFII-28) (TAFII28) (TFIID subunit p30-beta) |
| LOC391763 | 15.055618 | chr5 | similar to Transcription initiation factor TFIID subunit 11 (Transcription initiation factor TFIID 28 kDa subunit) (TAF(II)28) (TAFII-28) (TAFII28) (TFIID subunit p30-beta) |
| LOC646066 | 14.325004 | chr5 | similar to Transcription initiation factor TFIID subunit 11 (Transcription initiation factor TFIID 28 kDa subunit) (TAF(II)28) (TAFII-28) (TAFII28) (TFIID subunit p30-beta) |
| LOC391766 | 13.561946 | chr5 | similar to Transcription initiation factor TFIID subunit 11 (Transcription initiation factor TFIID 28 kDa subunit) (TAF(II)28) (TAFII-28) (TAFII28) (TFIID subunit p30-beta) |
| LOC402199 | 13.3026 | chr5 | similar to Transcription initiation factor TFIID subunit 11 (Transcription initiation factor TFIID 28 kDa subunit) (TAF(II)28) (TAFII-28) (TAFII28) (TFIID subunit p30-beta) |
| CLIC2 | 13.166692 | chrX | chloride intracellular channel 2 |
| REG3A | 12.277953 | chr2 | regenerating islet-derived 3 alpha |
| LOC285563 | 12.225561 | chr5 | similar to Transcription initiation factor TFIID subunit 11 (Transcription initiation factor TFIID 28 kDa subunit) (TAF(II)28) (TAFII-28) (TAFII28) (TFIID subunit p30-beta) |
| LOC391761 | 12.132503 | chr5 | similar to Transcription initiation factor TFIID subunit 11 (Transcription initiation factor TFIID 28 kDa subunit) (TAF(II)28) (TAFII-28) (TAFII28) (TFIID subunit p30-beta) |
| REG3A | 11.841921 | chr2 | regenerating islet-derived 3 alpha |
| LOC391745 | 10.417792 | chr5 | similar to Transcription initiation factor TFIID subunit 11 (Transcription initiation factor TFIID 28 kDa subunit) (TAF(II)28) (TAFII-28) (TAFII28) (TFIID subunit p30-beta) |
| LOC285697 | 10.091853 | chr5 | similar to Transcription initiation factor TFIID subunit 11 (Transcription initiation factor TFIID 28 kDa subunit) (TAF(II)28) (TAFII-28) (TAFII28) (TFIID subunit p30-beta) |
| LOC643211 | 9.717468 | chr2 | hypothetical protein LOC643211 |
| LOC653442 | 9.707283 | chr4 | similar to deubiquitinating enzyme 3 |
| REG3A | 9.436449 | chr2 | regenerating islet-derived 3 alpha |
| LOC649159 | 9.336311 | chr16 | similar to CG7467-PA, isoform A |
| LOC391742 | 9.3053875 | chr5 | similar to Transcription initiation factor TFIID subunit 11 (Transcription initiation factor TFIID 28 kDa subunit) (TAF(II)28) (TAFII-28) (TAFII28) (TFIID subunit p30-beta) |
| UNC5B | 9.165422 | chr10 | unc-5 homolog B (C. elegans) |
DHA induced differential gene ontology analysis
To obtain gene ontology on a specific cluster of genes in DHA treated xenograft, an in-depth analysis of microarray data was carried out. As shown in Figure 3, up-regulated genes were divided into several groups according to the category of ontology, including protein complex binding, protein kinase binding, kinase binding, actin binding, lipid binding, cytoskeletal protein binding, substrate-specific transporter activity, enzyme binding, protein binding and binding molecular. Meanwhile, down-regulated genes were divided into: sequence-specific DNA binding, cakium ion binding, protein dimerization activity, identical protein binding, ion transmembrane transporter activity, substrate-specific transmembrane transporter activity, transporter activity, receptor binding, transmembrane transporter activity, substrate-specific transporter activity and structural molecule activity molecular.
Figure 3.
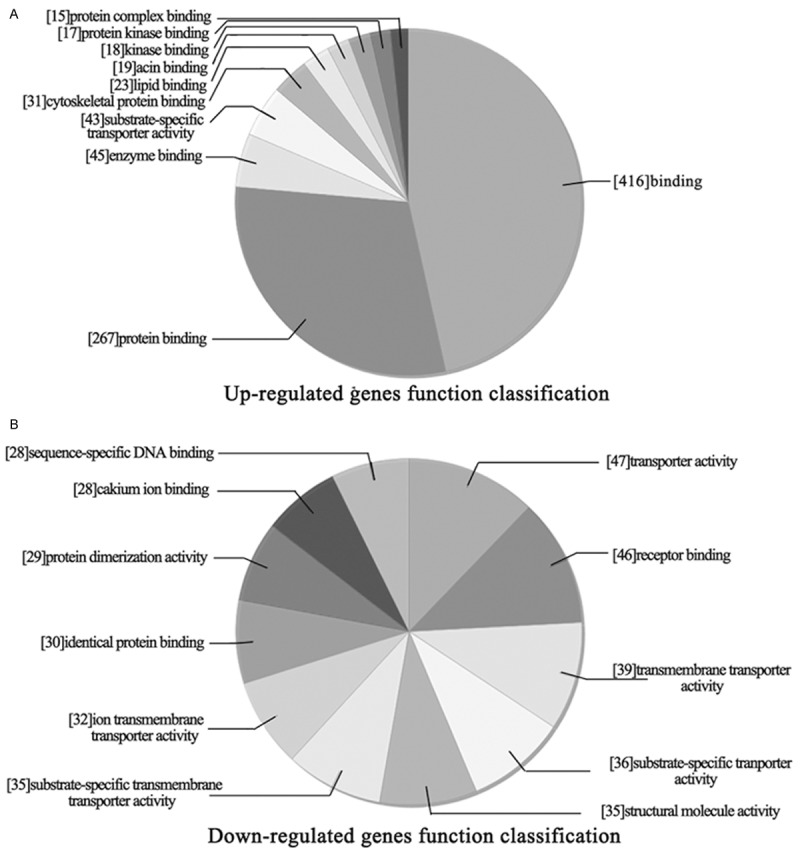
Molecular function classification of differentially expressed genes in DHA treated. A. Up-regulated genes function classification. B. Down-regulated genes function classification.
DHA induced differential genes involved in biological process
Furthermore, analyze the effect of DHA on tumor cell biological process. As shown in Figure 4, up-regulated genes (Figure 4A) mainly involved in signal transduction, signaling, cell communication, cellular response to stimulus, multicellular organismal, response to stimulus, cellular process, biological regulation, regulation of biological process and regulation of cellular process. Down-regulated genes (Figure 4B) mainly involved in localization, system development, signaling, cellular response to stimulus, cell communication, anatomical structure development, multicellular organismal process, response to stimulus, developmental process and multicellular organismal development.
Figure 4.
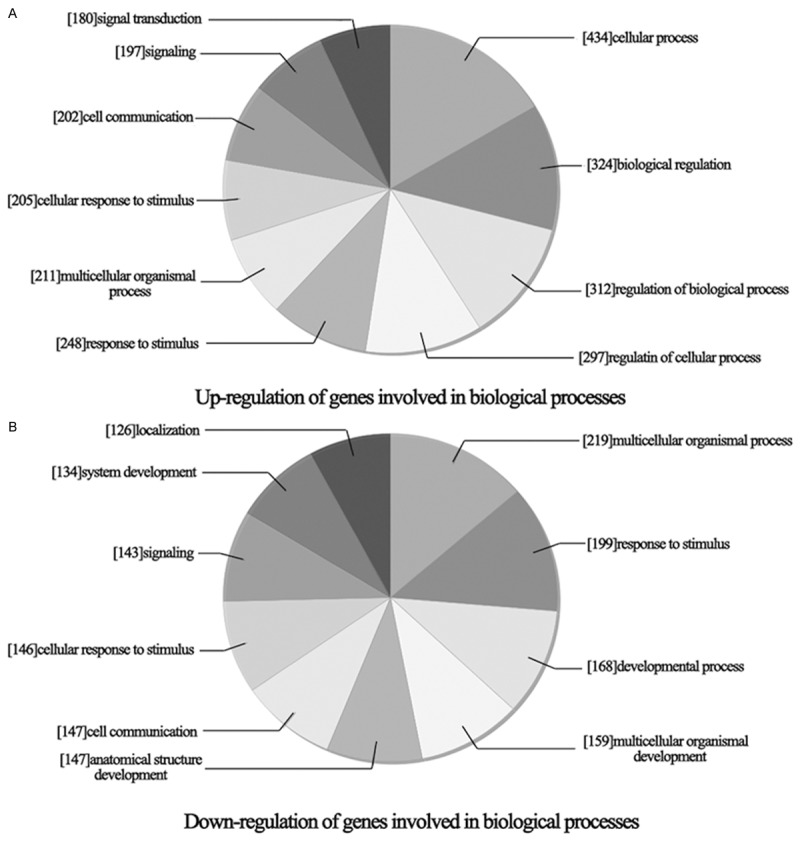
Biology process classification of differentially expressed genes in DHA treated. A. Up-regulation of genes involved in biological process. B. Down-regulation of genes involved in biological process.
DHA induced differential gene pathway analysis
Next, analyze the signal pathway involved in differential expression genes induced by DHA. As shown in Figure 5, up-regulated genes (Figure 5A) got primary involved in malaria, rheumatoid arthritis, epithelial cell signaling in Helicobacter pylori infection, endocytosis, MAPK signaling pathway, leukocyte transendothelial migration, Regulation of actin cytoskeleton, African trypanosomiasis, HTLV-1 infection and adherens junction. Down-regulated genes (Figure 5B) got mostly involved in hypertrophic cardiomyopathy, glioma, TGF-beta signaling pathway, ECM-receptor interaction, MAPK signaling pathway, dopaminergic synapse, prostate cancer, focal adhesion, melanoma and cholinergic synapse.
Figure 5.

Pathway analysis of genes differentially expressed in DHA treated. A. Up-regulated genes involved in signal pathways. B. Down-regulated genes involved in signal pathways.
RT-PCR detects genes expression in xenograft tumors and colon cancer cells HCT-15
As microarray assays showed that, the mRNA level expression of COX2, HIF-1α, VEGF-A, COMP, MMP-1, MMP-9, SCP2 and SDC3 in DHA treated tumors were down-regulated by 2-3 folds. Then, RT-PCR was used to verify the 8 genes expression, and to explore the roles of them in DHA anti-cancer effect. As shown in Figure 6A, the expression of COX2, HIF-1α, VEGF-A, COMP, MMP-1, MMP-9, SCP2 and SDC3 were significantly reduced in DHA treated mice tumors. Those results indicated that COX2, HIF-1α/VEGF-A and MMPs signal pathways might mediate DHA inhibited colon cancer growth. Furthermore, we detected the effect of DHA on COX2, HIF-1α, VEGF-A, COMP, MMP-1, MMP-9, SCP2 and SDC3 expression in cultured colon cancer cells HCT-15. After 48 h treatment with DHA, COX2, HIF-1α, VEGF-A, COMP, MMP-1, MMP-9, SCP2 and SDC3 expression were obviously decreased. Collectively, this result was completely consistent with the results in vivo.
Figure 6.
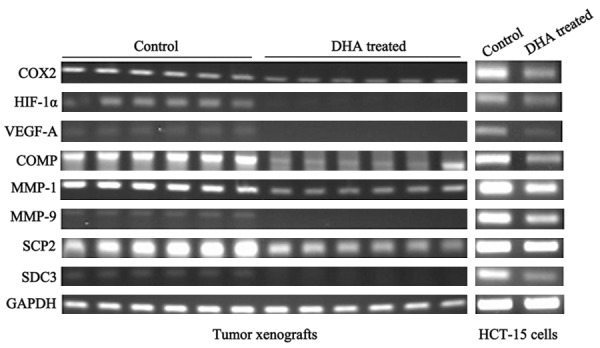
mRNA levels expression of genes differentially expressed in DHA treated: RT-PCR analysis was conducted using sequence specific primers for selected expressed genes to confirmation the expression changes detected by the cDNA microarrays.
Discussion
In this study, we demonstrated that DHA could inhibit colon xenograft tumor formation and growth in vivo. Then, cDNA microarray analysis and RT-PCR analysis were used to screened and identified the different genes and signal pathways involved in this process. We found that DHA inhibited colon cancer growth was a complex process of multi factors and multi plane interconnected, containing molecular interaction, receptor activity, membrane receptor trafficking and so on. In addition, this study confirmed that DHA down-regulated several genes expression related to tumor growth and metastasis including COX2, HIF-1α, VEGF-A, COMP, MMP-1, MMP-9, SCP2, SDC3.
Cyclooxygenase (COX), known as prostaglandin (PG) H2 synthase, is the rate-limiting enzyme in the conversion of arachidonic acid into PGs. COX has two kinds of isoenzymes COX1 and COX2. As an inducible enzyme, overexpression of COX2 has been frequently observed in melanoma, colon cancer, breast cancer, liver cancer, cervical cancer, esophageal cancer, pancreatic cancer, gastric cancer, but rarely examined in normal tissues [12,13]. Many studies have implicated that PGE2, the metabolite of COX2 enzyme, can promote the extracellular matrix degradation and induce cancer cell invasion and metastasis [14]. When COX2 is targeted through either gene knockouts or COX2-specific inhibitors, a significant reduction of number of tumors is observed suggesting that COX2 plays a key role in colon tumorigenesis [15]. DHA can be used as a competitive inhibitor of COX2 and block PGs (mainly PGE2) synthesis, thus inhibit tumor cell proliferation [16,17].
In addition, studies have shown that COX2/PGE2 is closely related to inflammation, cell cycle progression and angiogenesis [18]. Angiogenesis is the precondition of tumor growth, invasion and metastasis. Several growth factors involve in endothelial cell proliferation, migration and angiogenesis, and VEGF which mediates tumor vascularization and subsequently initiates the formation of metastases [19] is the most prominent and the most important factor for tumor angiogenesis. Study shows that over-expression of COX2 can promote VEGF expression through up-regulating HIF-1α expression, thus inducing tumor angiogenesis [20]. ω-3 PUFA suppresses colon cancer cell proliferation, angiogenesis and metastasis by inhibiting COX2 expression in vitro [14]. Rao et al reported that fish oil diet could reduce the activity of COX2 and suppress tumor growth in xenograft rat model of colon cancer [21]. In this study, we confirmed that DHA inhibition of colon cancer had a high correlation with down-regulation of COX2-HIF-1 α-VEGF pathway both in vitro and in vivo.
Cartilage oligomeric matrix protein (COMP) is a member of the thrombospondin family of extracellular glycoproteins. The function of COMP remains unclear, but it may have a structural role in endochondral ossification and in the assembly and stabilization of the extracellular matrix by its interaction with collagen fibrils and matrix components [22]. Matrix metalloproteinases (MMPs) are a family of multi-domain Ca2+-dependent and Zn2+-containing endopeptidases, which can degrade almost all components of the extracellular matrix (ECM) [23]. Recent evidence has implicated MMPs in the regulation cell proliferation, migration, differentiation, angiogenesis, inflammation and signaling [24,25]. In this study, we detected DHA could inhibit COMP, MMP1 and MMP9 expression both in vivo and in vitro, indicating that COMP, MMP1 and MMP9 might mediate the inhibition of DHA on colon cancer.
Sterol carrier protein 2 (SCP2) is a soluble alkaline protein, which play an important role in cholesterol biosynthesis, transport, transformation [26]. Syndecan 3 (SDC3) is a kind of cell surface transmembrane proteoglycan protein, which belongs to the syndecan family proteins. Syndecans are capable of mediating a broad range of functions including cell-cell and cell-extracellular matrix adhesion as well as acting as co-receptors in growth factor binding. In this study, we found that SCP2 and SDC3 expressions were down-regulated after colon cancer cells or colon xenograft tumor models were treated with DHA.
In summary, we firstly used cDNA microarrays of colon xenograft tumor to screen a vast array of DHA-responsive signaling genes and molecules representing several signaling pathways involved in colon cancer growth. The modulation of colon cancer cell growth by DHA is apparently mediated through the inhibition of COX2, HIF-1α, VEGF-A, COMP, MMP-1, MMP-9, SCP2 and SDC3 expression. However, the detailed molecular mechanisms of DHA inhibited those genes expression are not clear and remain to be elucidated.
Acknowledgements
This study was supported by the National Natural Science Foundation of China (81372433), The Natural Science Foundation of Jiangsu Province of China (BK20131149) and the Suzhou Administration of Science & Technology (SYS201360 and SYS201254).
Disclosure of conflict of interest
None.
References
- 1.Grady WM, Carethers JM. Genomic and epigenetic instability in colorectal cancer pathogenesis. Gastroenterology. 2008;135:1079–1099. doi: 10.1053/j.gastro.2008.07.076. [DOI] [PMC free article] [PubMed] [Google Scholar]
- 2.Itzkowitz SH, Yio X. Inflammation and cancer IV. Colorectal cancer in inflammatory bowel disease: the role of inflammation. Am J Physiol Gastrointest Liver Physiol. 2004;287:G7–17. doi: 10.1152/ajpgi.00079.2004. [DOI] [PubMed] [Google Scholar]
- 3.Calder PC. Dietary modification of inflammation with lipids. Proc Nutr Soc. 2002;61:345–358. doi: 10.1079/pns2002166. [DOI] [PubMed] [Google Scholar]
- 4.Siddiqui RA, Harvey K, Stillwell W. Anticancer properties of oxidation products of docosahexaenoic acid. Chem Phys Lipids. 2008;153:47–56. doi: 10.1016/j.chemphyslip.2008.02.009. [DOI] [PubMed] [Google Scholar]
- 5.Jump DB. Dietary polyunsaturated fatty acids and regulation of gene transcription. Curr Opin Lipidol. 2002;13:155–164. doi: 10.1097/00041433-200204000-00007. [DOI] [PubMed] [Google Scholar]
- 6.Lim K, Han C, Dai Y, Shen M, Wu T. Omega-3 polyunsaturated fatty acids inhibit hepatocellular carcinoma cell growth through blocking beta-catenin and cyclooxygenase-2. Mol Cancer Ther. 2009;8:3046–3055. doi: 10.1158/1535-7163.MCT-09-0551. [DOI] [PMC free article] [PubMed] [Google Scholar]
- 7.Jing K, Song KS, Shin S, Kim N, Jeong S, Oh HR, Park JH, Seo KS, Heo JY, Han J, Park JI, Han C, Wu T, Kweon GR, Park SK, Yoon WH, Hwang BD, Lim K. Docosahexaenoic acid induces autophagy through p53/AMPK/mTOR signaling and promotes apoptosis in human cancer cells harboring wild-type p53. Autophagy. 2011;7:1348–1358. doi: 10.4161/auto.7.11.16658. [DOI] [PMC free article] [PubMed] [Google Scholar]
- 8.Glade MJ. Food, nutrition, and the prevention of cancer: a global perspective. American Institute for Cancer Research/World Cancer Research. Nutrition. 1999;15:523–526. doi: 10.1016/s0899-9007(99)00021-0. [DOI] [PubMed] [Google Scholar]
- 9.Mori TA, Beilin LJ. Omega-3 fatty acids and inflammation. Curr Atheroscler Rep. 2004;6:461–467. doi: 10.1007/s11883-004-0087-5. [DOI] [PubMed] [Google Scholar]
- 10.Wang SJ, Gao Y, Chen H, Kong R, Jiang HC, Pan SH, Xue DB, Bai XW, Sun B. Dihydroartemisinin inactivates NF-kappaB and potentiates the anti-tumor effect of gemcitabine on pancreatic cancer both in vitro and in vivo. Cancer Lett. 2010;293:99–108. doi: 10.1016/j.canlet.2010.01.001. [DOI] [PubMed] [Google Scholar]
- 11.Davidson LA, Nguyen DV, Hokanson RM, Callaway ES, Isett RB, Turner ND, Dougherty ER, Wang N, Lupton JR, Carroll RJ, Chapkin RS. Chemopreventive n-3 polyunsaturated fatty acids reprogram genetic signatures during colon cancer initiation and progression in the rat. Cancer Res. 2004;64:6797–6804. doi: 10.1158/0008-5472.CAN-04-1068. [DOI] [PMC free article] [PubMed] [Google Scholar]
- 12.Wang M, Su Y, Sun H, Wang T, Yan G, Ran X, Wang F, Cheng T, Zou Z. Induced endothelial differentiation of cells from a murine embryonic mesenchymal cell line C3H/10T1/2 by angiogenic factors in vitro. Differentiation. 2010;79:21–30. doi: 10.1016/j.diff.2009.08.002. [DOI] [PubMed] [Google Scholar]
- 13.Hirschi KK, Ingram DA, Yoder MC. Assessing identity, phenotype, and fate of endothelial progenitor cells. Arterioscler Thromb Vasc Biol. 2008;28:1584–1595. doi: 10.1161/ATVBAHA.107.155960. [DOI] [PMC free article] [PubMed] [Google Scholar]
- 14.Yang N, Li D, Jiao P, Chen B, Yao S, Sang H, Yang M, Han J, Zhang Y, Qin S. The characteristics of endothelial progenitor cells derived from mononuclear cells of rat bone marrow in different culture conditions. Cytotechnology. 2011;63:217–226. doi: 10.1007/s10616-010-9329-2. [DOI] [PMC free article] [PubMed] [Google Scholar]
- 15.Oshima M, Dinchuk JE, Kargman SL, Oshima H, Hancock B, Kwong E, Trzaskos JM, Evans JF Taketo MM. Suppression of intestinal polyposis in Apc delta716 knockout mice by inhibition of cyclooxygenase 2 (COX-2) Cell. 1996;87:803–809. doi: 10.1016/s0092-8674(00)81988-1. [DOI] [PubMed] [Google Scholar]
- 16.Schley PD, Brindley DN, Field CJ. (n-3) PUFA alter raft lipid composition and decrease epidermal growth factor receptor levels in lipid rafts of human breast cancer cells. J Nutr. 2007;137:548–553. doi: 10.1093/jn/137.3.548. [DOI] [PubMed] [Google Scholar]
- 17.Hofmanova J, Vaculova A, Kozubik A. Polyunsaturated fatty acids sensitize human colon adenocarcinoma HT-29 cells to death receptor- mediated apoptosis. Cancer Lett. 2005;218:33–41. doi: 10.1016/j.canlet.2004.07.038. [DOI] [PubMed] [Google Scholar]
- 18.Badawi AF, Badr MZ. Expression of cyclooxygenase-2 and peroxisome proliferator-activated receptor-gamma and levels of prostaglandin E2 and 15-deoxy-delta12,14-prostaglandin J2 in human breast cancer and metastasis. International journal of cancer. Int J Cancer. 2003;103:84–90. doi: 10.1002/ijc.10770. [DOI] [PubMed] [Google Scholar]
- 19.Chiarugi V, Magnelli L, Gallo O. Cox-2, iNOS and p53 as play-makers of tumor angiogenesis (review) Int J Mol Med. 1998;2:715–719. doi: 10.3892/ijmm.2.6.715. [DOI] [PubMed] [Google Scholar]
- 20.Jung YJ, Isaacs JS, Lee S, Trepel J, Neckers L. IL-1beta-mediated up-regulation of HIF-1alpha via an NFkappaB/COX-2 pathway identifies HIF-1 as a critical link between inflammation and oncogenesis. FASEB J. 2003;17:2115–2117. doi: 10.1096/fj.03-0329fje. [DOI] [PubMed] [Google Scholar]
- 21.Rao CV, Simi B, Wynn TT, Garr K, Reddy BS. Modulating effect of amount and types of dietary fat on colonic mucosal phospholipase A2, phosphatidylinositol-specific phospholipase C activities, and cyclooxygenase metabolite formation during different stages of colon tumor promotion in male F344 rats. Cancer Res. 1996;56:532–537. [PubMed] [Google Scholar]
- 22.Tseng S, Reddi AH, Di Cesare PE. Cartilage Oligomeric Matrix Protein (COMP): A Biomarker of Arthritis. Biomark Insights. 2009;4:33–44. doi: 10.4137/bmi.s645. [DOI] [PMC free article] [PubMed] [Google Scholar]
- 23.Visse R, Nagase H. Matrix metalloproteinases and tissue inhibitors of metalloproteinases: structure, function, and biochemistry. Circ Res. 2003;92:827–839. doi: 10.1161/01.RES.0000070112.80711.3D. [DOI] [PubMed] [Google Scholar]
- 24.Ravi A, Garg P, Sitaraman SV. Matrix metalloproteinases in inflammatory bowel disease: boon or a bane? Inflamm Bowel Dis. 2007;13:97–107. doi: 10.1002/ibd.20011. [DOI] [PubMed] [Google Scholar]
- 25.Yong VW, Power C, Forsyth P, Edwards DR. Metalloproteinases in biology and pathology of the nervous system. Nat Rev Neurosci. 2001;2:502–511. doi: 10.1038/35081571. [DOI] [PMC free article] [PubMed] [Google Scholar]
- 26.Gallegos AM, Atshaves BP, Storey SM, Starodub O, Petrescu AD, Huang H, McIntosh AL, Martin GG, Chao H, Kier AB, Schroeder F. Gene structure, intracellular localization, and functional roles of sterol carrier protein-2. Prog Lipid Res. 2001;40:498–563. doi: 10.1016/s0163-7827(01)00015-7. [DOI] [PubMed] [Google Scholar]


