
Figure 2.
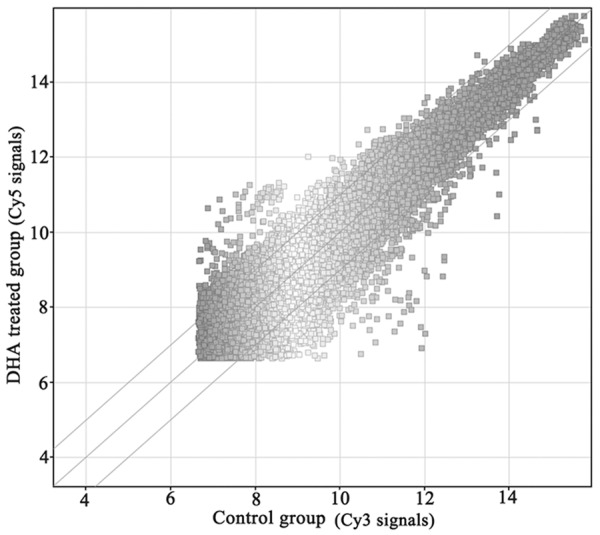
Scatter plot view of gene expression. Expression intensity Cy5: Cy3 ratios of DHA-treated versus untreated HCT-15 cells. The ratios (Cy-5: Cy-3) of genes that have 2-fold expression were considered up-regulated, and those with 0.5-fold expression were considered down-regulated. Approximately 2073 differentially expressed genes were detected in DHA treated.