
Figure 1.
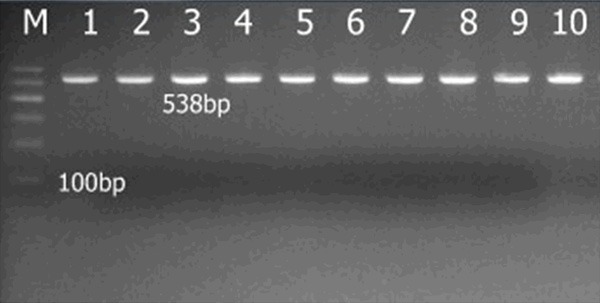
Gel electrophoresis images of PCR amplification products: “M” represents Marker. There are 6 bands between 100 bp and 600 bp. “1-10” represents the 10 samples. Samples 1-10 had a 538-bp CYP11B2 gene PCR amplification product.
Official websites use .gov
A
.gov website belongs to an official
government organization in the United States.
Secure .gov websites use HTTPS
A lock (
) or https:// means you've safely
connected to the .gov website. Share sensitive
information only on official, secure websites.
Gel electrophoresis images of PCR amplification products: “M” represents Marker. There are 6 bands between 100 bp and 600 bp. “1-10” represents the 10 samples. Samples 1-10 had a 538-bp CYP11B2 gene PCR amplification product.