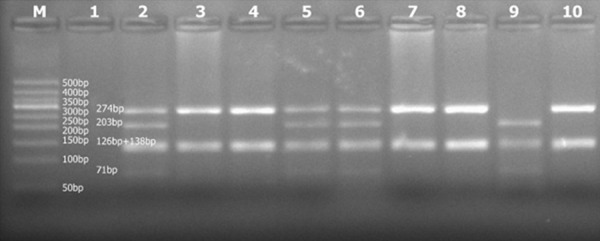
Figure 2.

Gel electrophoresis images of restriction-digested PCR amplification products: “M” represents Marker. There are 9 bands between 50 bp and 600 bp. Sample 1 is an empty well (no DNA sample); samples 3, 4, 7, 8, and 10 show the fully mutated TT genotype; sample 9 shows the wild-type CC genotype; samples 2, 5, and 6 show the partial mutant CT genotype. The 126-bp band and the 138-bp band have a similar size. The bands overlap and appear as a relatively wider band.
