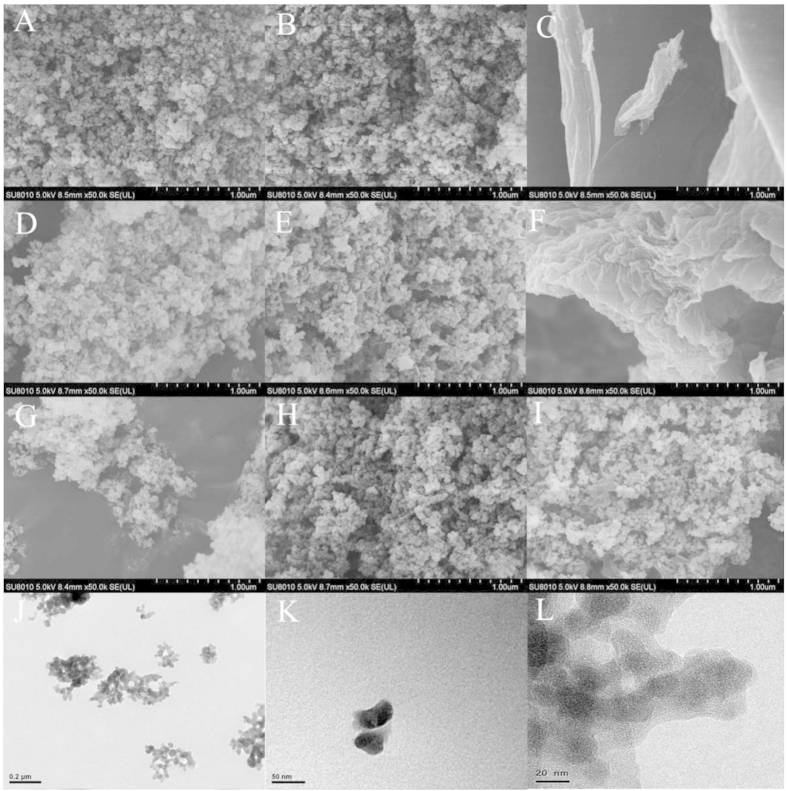
Figure 2. The microstructure of materials.
SEM images of SiO2 (A), NH2-SiO2 (B), graphene oxide (C), ASGO (100:2) (D), ASrGO (100:2) (E), pristine graphene sheets (F), ASG (100:0.5) (G), ASG (100:1) (H) and ASG (100:2) (I). HR-TEM images of ASG (100:2) in bulk view (J) and at high magnification (K, L).

