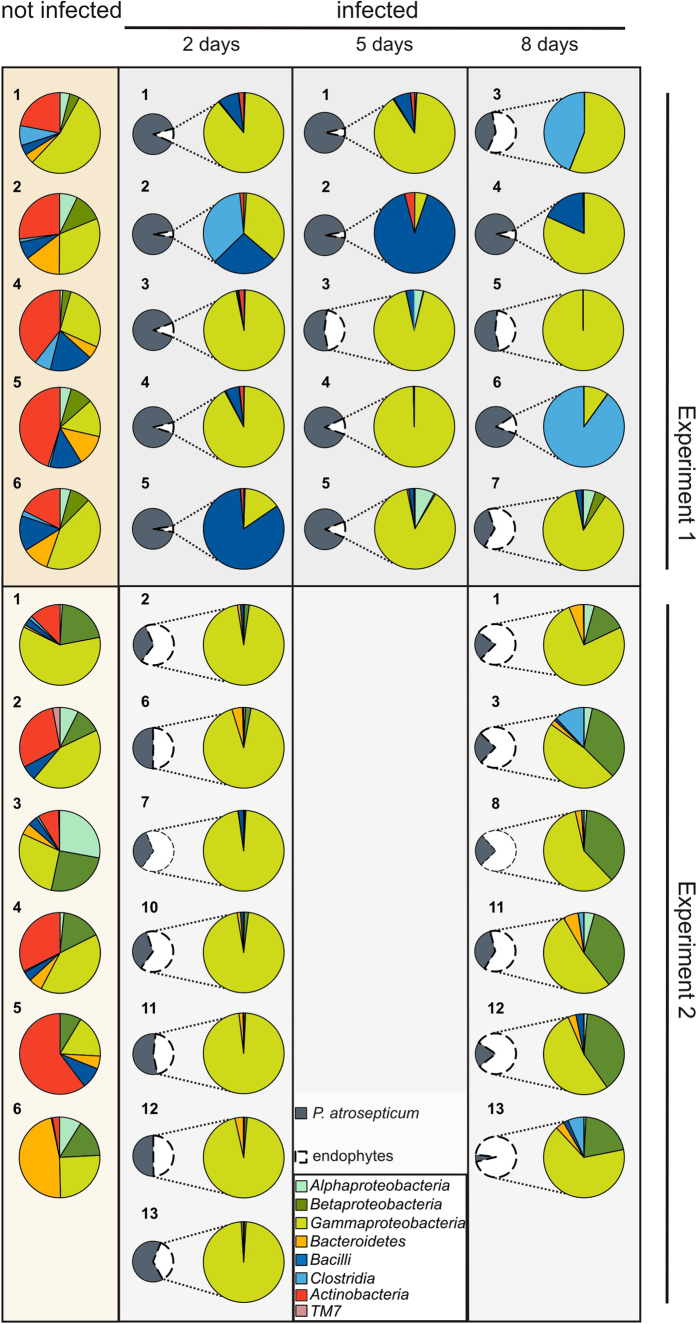
Figure 4. Phyla/class level distribution of all sequence reads from each potato sample.
Taxonomic assignments were made using the Ribosomal Database Project (50% confidence threshold). Small pie charts show the percentage of P. atrosepticum reads (dark grey 98% identity) among total sequence reads from individual potatoes. The larger pie charts show the composition of the dominant endophytic bacterial community, the colored segments represent bacterial phyla/classes that were most abundant in each sample. (The numbering of potato samples is recurrent throughout the study).

