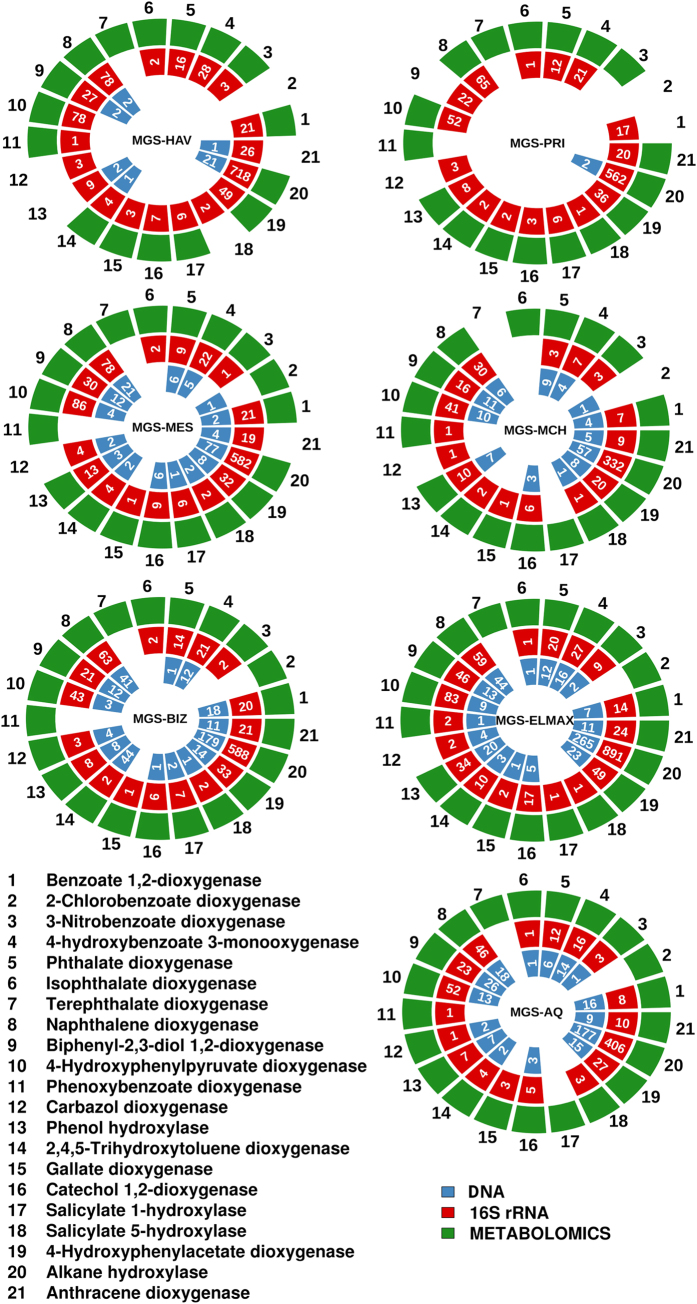
Figure 2. Enrichment and metabolomics-based experimental validation (green color) of degradation capacities mediated by presumptive enzymes encoded by catabolic genes expected on the basis of DNA (blue color) and 16S rRNA (red color) data sets.
The number of genes encoding catabolic enzymes per each of the datasets is given inside the colored boxes. Briefly, enrichment cultures in ONR7a medium were performed, as described in Supplementary Methods, for each of the sediment samples in the presence of a pollutant mixture (10 mM total concentration) containing the following pollutants as a unique carbon source: naphthalene, anthracene, 2,3-dihydroxybiphenyl, 3,4-phenoxybenzoate, carbazole, phenol, 2,4,5-trihydroxytoluene, gallate, tetradecane, benzoate, 4-chlorobenzoate, 3-nitrobenzoate, 4-hydroxybenzoate, phthalate, isophthalate, terephthalate, and 4-hydroxyphenylpyruvate. Triplicate cultures for each duplicate sediment samples per site were set up. Two control experiments (in triplicates) were used: i) cultures without the addition of sediments but with chemicals; ii) cultures plus sediments but without the addition of chemicals. After 3 weeks of incubation, the rel. ab. of mass signatures of all the tested pollutants (data available in Supplementary Table S7A) and 9 key degradation intermediates including catechol, chlorocatechol, salicylate, muconate, gentisate, protocatechuate, homogentisate, myristate and homoprotocatechuate (data available in Supplementary Table S7B) was linked to the presence of 21 key genes encoding catabolic enzymes involved either in their degradation (in case of initial pollutants) or their production (in case of intermediates). See Supplementary Methods for descriptions of the links. Quantification was performed by target analysis using GC-Q-MS and LC-QTOF-MS. Colored box indicates DNA-, 16S rRNA- or metabolite-based signatures for a given catabolic gene. Confidence greater than 90% as indicated in Supplementary Table S5. Note: sample ELF was not included for the validation experiment, as no DNA data sets were available.

