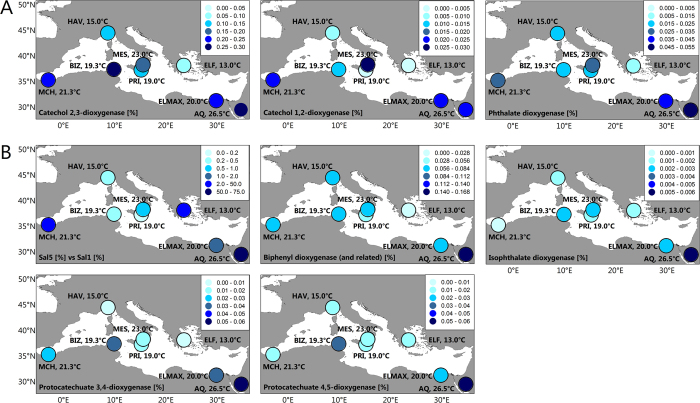
Figure 6. Multi-panel map of the spatial distribution of catabolic genes abundance (DNA + 16S rRNA) in the study area.
Panels (A) and (B) represent genes most representative of low- and high-temperature sites, respectively. Site temperatures are indicated in the panels. The values are represented by colored dots. See the legend in each panel as a reference. Spatial distributions of gene percentages in the study area (for details see Supplementary Table S5) were produced using Golden Software Surfer 8.0. The data are plotted as colored dots showing the true values at each sampling station. Note, than in Panel B, the first map illustrates the relative percentage of genes encoding salicylate-5-hydrolyases (Sal5) as compared to salicylate-1-hydroxylases (Sal1). Reactions associated to genes encoding enzymes in panels, as follows: Catechol-2,3-dioxygenase (XylE): catechol ⇒ cis,cis-2-hydroxy-6-oxohexa-2,4-dienoate (code 124, Fig. 3); Catechol-1,2-dioxygenase (CatA): catechol ⇒ cis,cis-muconic acid (code 109, Fig. 3); Phathalate dioxygenase (OphA): phthalate ⇒ Protocatechuate; Salicylate-5-hydrolyase (Sal5 or NahGH): salicylate ⇒ gentisate; Salicylate-1-hydrolyase (Sal1): salicylate ⇒ catechol; Biphenyl dioxygenase (Bph): biphenyl ⇒ biphenyl-2-3-diol (code 51, Fig. 3); Isophathalate dioxygenase: isophthalate ⇒ protocatechuate; Protocatechuate 3,4-dioxygenase: Protocatechuate ⇒ 3-carboxy-cis,cis-muconate (code 104, Fig. 3); Protocatechuate 4,5-dioxygenase: Protocatechuate ⇒ 2-hydroxy-4-carboxymuconate-6-semialdehyde (code 099, Fig. 3).

