
Figure 7. Box plot of the relative contribution of genes involved in degradation steps.
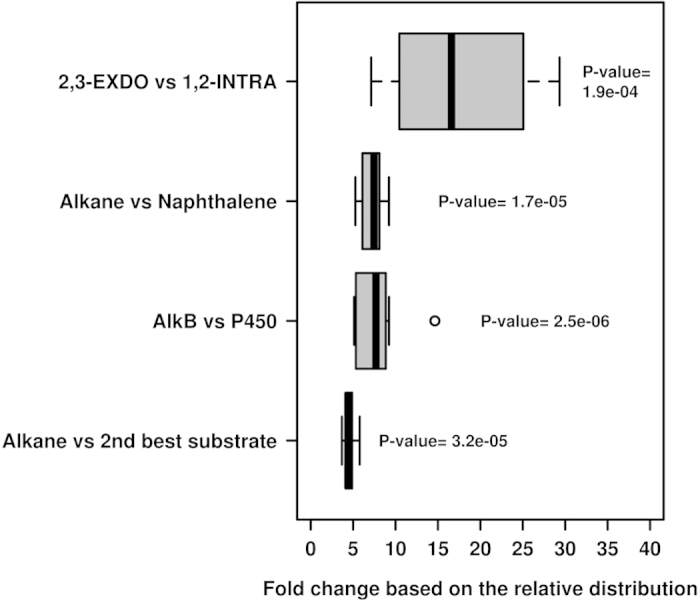
Percentages were calculated on the basis of the data obtained from the DNA and 16S rRNA gene content analysis. P-values correspond to Student’s t-test of the average of the relative contribution of the enzyme classes, as based on the Welch approximation.