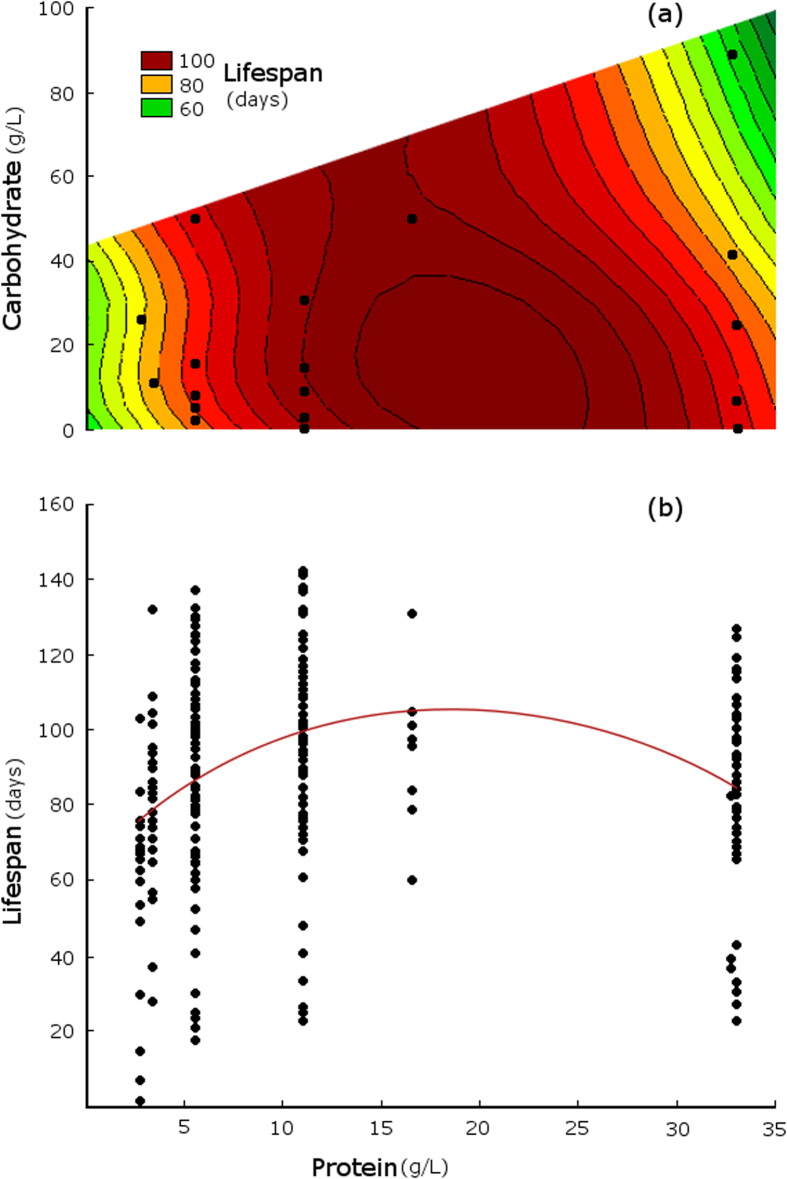
Figure 2. Effect of larval nutrients on adult lifespan.
(a) Response surface for adult lifespan as a function of protein and carbohydrate content of the larval diet. Values of the response variable (lifespan in days) are indicated by colour, based on thin-plate spline projection fitted to replicate means. Points show larval diets. (b) Adult lifespan as a function of protein content (g/L) in the larval diet. Points show individual data points, line shows quadratic fit.

