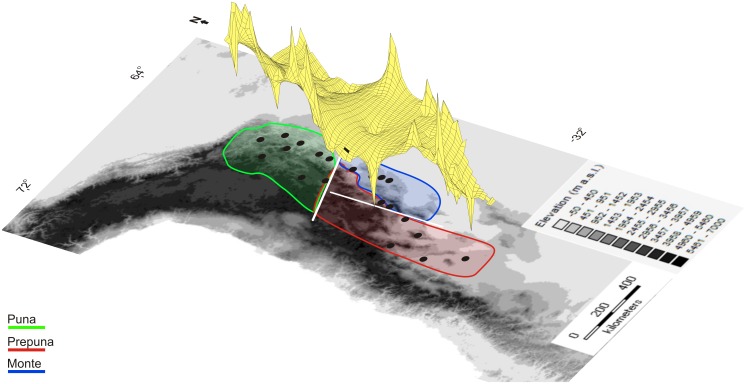
Fig 3. Multidimensional graph produced by the genetic landscape shape interpolation analysis that represents the genetic distances of haplotypes across the distribution range of M. argentina.
White bars identify phylogeographic barriers in the unglaciated part of the SATZ that separate three groups of populations: Puna, Prepuna and Monte.

