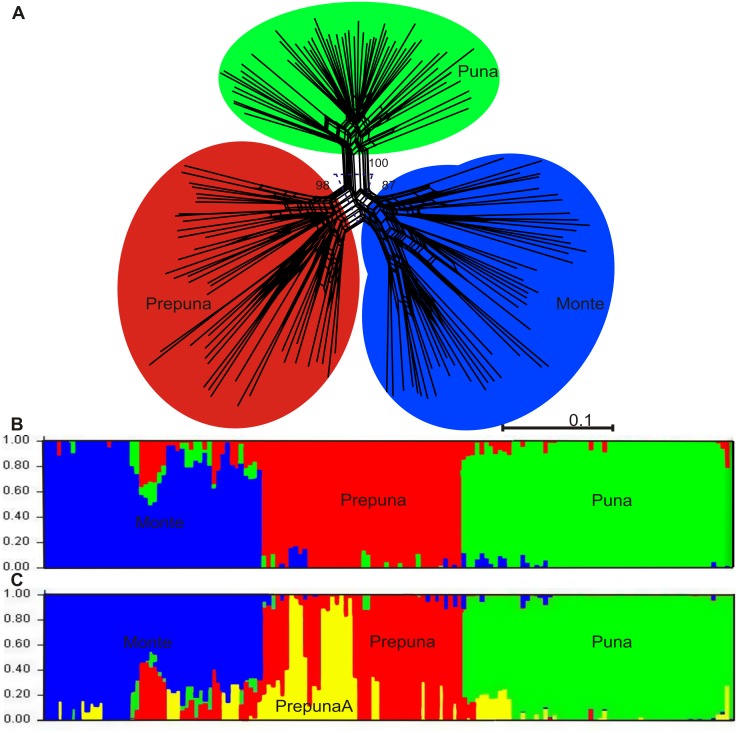
Fig 4. Inferred clustering from NeighborNet (A) (numbers are the bootstrap values), and from a Bayesian assignment with STRUCTURE assuming K = 3 (B), and K = 4 (C).
Each individual is represented by a single vertical line, partitioned into K colored segments that denote the individual’s estimated membership fractions in K clusters. Scale bar shows a distance of 0.1 substitutions per site.

