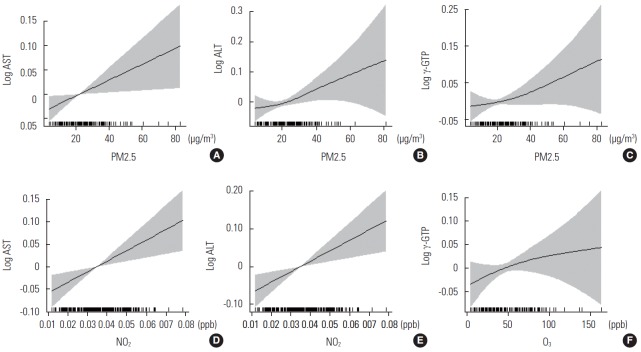
Figure. 1.
Penalized regression splines of particulate matter ≤2.5 μm (PM2.5) concentrations on (A) lag day 3 for aspartate aminotransferase (AST), (B) lag day 2 for alanine aminotransferase (ALT), and (C) lag day 3 for γ-glutamyltranspeptidase (γ-GTP); nitrogen dioxide (NO2) concentrations on (D) lag day 2 for AST and (E) ALT; and ozone (O3) concentrations on (F) lag day 4 for γ-GTP. Solid lines, spline curve; shaded area, 95% confidence interval. Y-axis indicates difference from the mean of each log-transformed liver enzyme level. All models were adjusted for age, sex, smoking status, mean temperature, dew point, season, body mass index, alcohol consumption, and amount of exercise. ppb, parts per billion.

