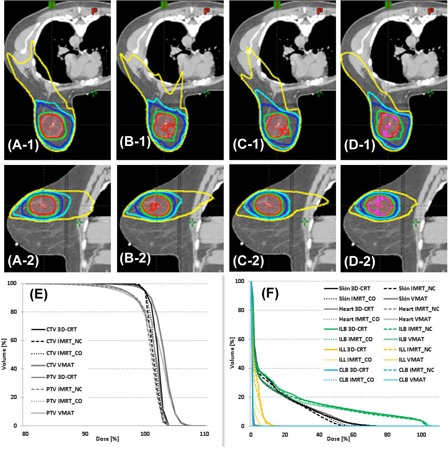
Figure 1.

Isodose distributions of 3D CRT (A‐1 & A‐2), (B‐1 & B‐2), (C‐1 & C‐2), and VMAT (D‐1 & D‐2) in axial view (top row) and sagittal view (bottom row), as well as dose‐volume histograms of CTV and PTV (E) and normal tissues (F). , and isodose lines; GTV is contoured in red, CTV in orange, and PTV in pink.
