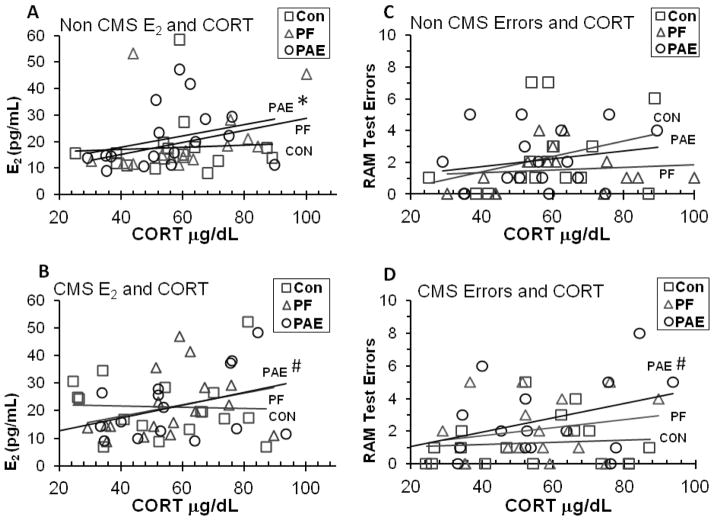
Figure 6.
(A) PAE-Non CMS females showed a marginally significant positive correlation (P = 0.057) between E2 and CORT, whereas (B) PAE-CMS females showed trends toward positive correlations between E2 and CORT (P = 0.075), and (D) between Errors and CORT (r = 0.44, P = 0.081). Neither Con nor PF females showed any correlations between E2 and CORT or between Errors and CORT, regardless of CMS condition (all Ps > 0.10).

