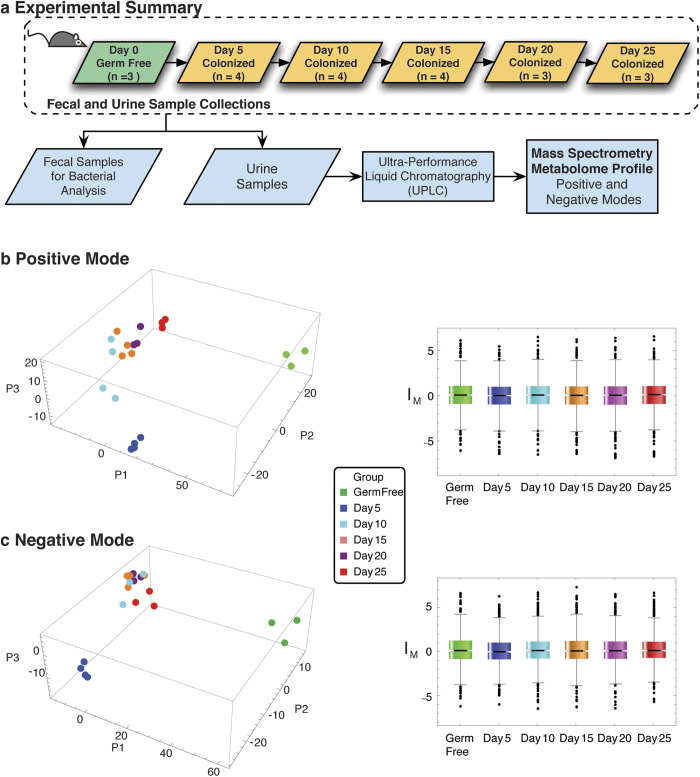
Figure 1. Inoculation of Germ Free Mice.
(a) Germ free mice were inoculated on Day 0 with Bacteriodes. thetaiotaomicron and Bifidobacterium longum by oral gavage ingestion. Urine and fecal samples were processed for metabolome and colony profiling respectively from these mice on days 5, 10, 15, 20, 25. Principal Component Analysis in both Positive (b) and Negative (c) acquisition mode full metabolome results reveal that the mice samples aggregate into groups, with the Germ Free and Day 5 groups well separated. The components account for 81% and 80% of the variances in Positive and Negative modes respectively. The corresponding normalized distributions are shown on the right panels displaying similar profiles, where intensities IM have been standardized (with median and median absolute deviation), indicating symmetry in approach in positive and negative modes. See also Supplementary Fig. S1, Supplementary Table S1.

