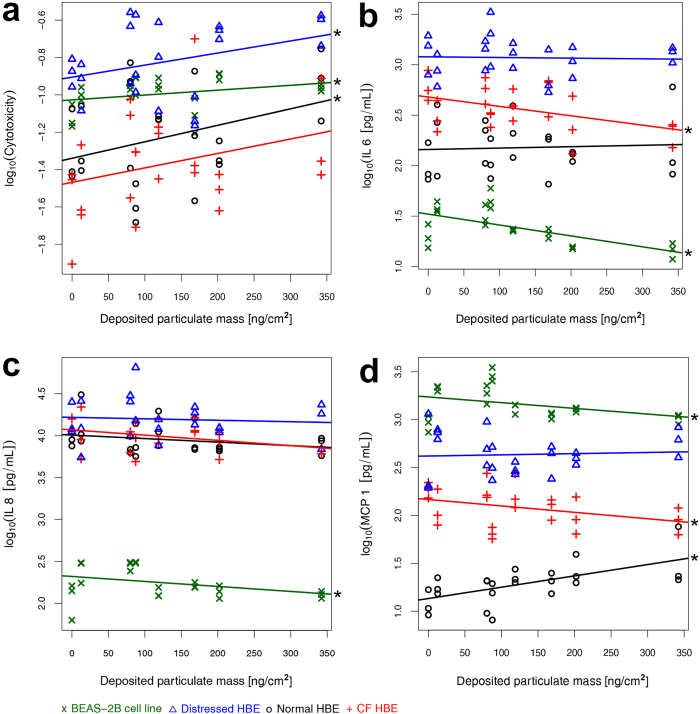
Figure 4. Cellular responses to increasing particle dose.
(a) Cytotoxicity measured as fraction of total lactate dehydrogenase (LDH) released from damaged cells into the apical compartment. The inflammatory response was assessed by release of the cytokines (b) interleukin (IL)-6, (c) IL-8 and (d) monocyte chemotactic protein (MCP-1) . Data are presented as individual values of each cell culture. Linear trend lines for each cell model were determined using standard linear regression (see Methods section for details of statistical analyses). Stars (*) indicate a significant (p < 0.05) linear correlation to particle dose. BEAS-2B: human bronchial epithelial cell line; HBE cells: human bronchial epithelial cells; CF: cystic fibrosis.

