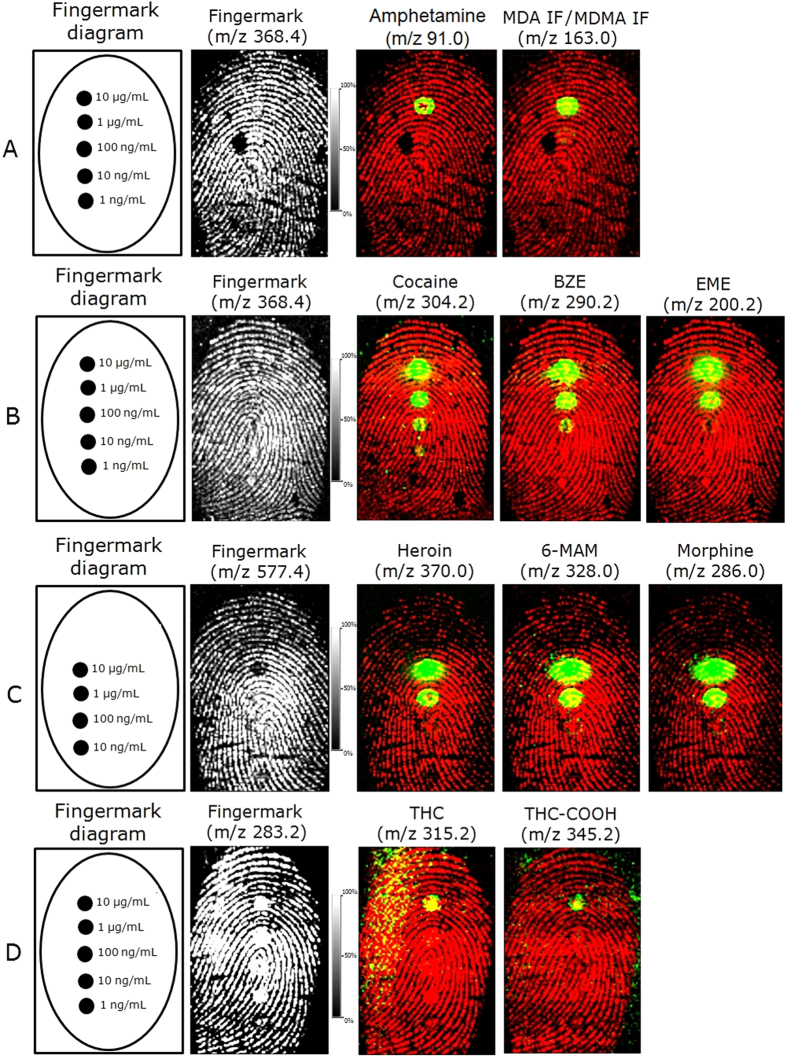
Figure 3. MALDI MSI of serial dilutions ranging from 10 μg/mL to 1 ng/mL of the different drug classes (drug/metabolites) spotted on top of a fingermark and subsequently spray-coated.
LODs were determined from (A) the amphetamine mixture, (B) the cocaine mixture, (C) the heroin mixture and (D) the THC mixture. The ion signals of the compounds are shown as an overlay (green) on top of the ion signal originating from an endogenous species (red) depicting the ridge pattern.

