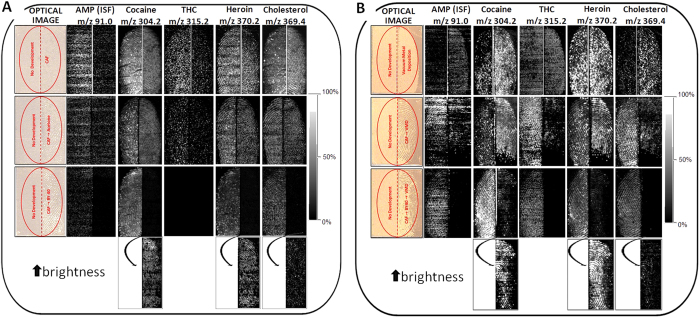
Figure 5. MALDI MS images of split fingermarks spiked with a mixture of 4 drugs and analysed with and without prior FET development. All images were normalised to total ion current, but each entire fingermark image was adjusted to optimal brightness and contrast.
A: MALDI MS images acquired after CAF, CAF + acetone vapour exposure and CAF + BY40 staining. The last row of the panel shows the brightness increased to reveal enhanced 2D maps of cocaine, heroin and cholesterol. B: MALDI MS images acquired after VMD, VMD + CAF and CAF + BY40 staining + VMD. For both panels A and B, the last row of the panels shows brightness increased to reveal enhanced 2D maps of cocaine, heroin and cholesterol.

