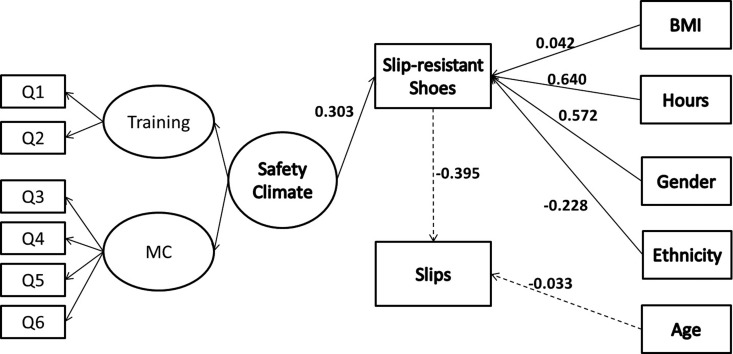
Figure 2.
Results from a structural equation model examining the relationship between safety climate, safety performance (wearing slip-resistant shoes) and slips in limited service restaurant employees. Only significant pathways are displayed. Dashed lines represent negative binomial regression analyses; solid lines indicate logistic regression analyses; β coefficients are displayed for each regression. The Gender results indicate that females were more likely to wear slip-resistant shoes than males. The ethnicity results indicate that non-Hispanic Caucasian were more likely to wear slip-resistant shoes than any other race/ethnicity categories. Other demographic variables were continuous. MC, Management Commitment to Safety; BMI, body mass index.

