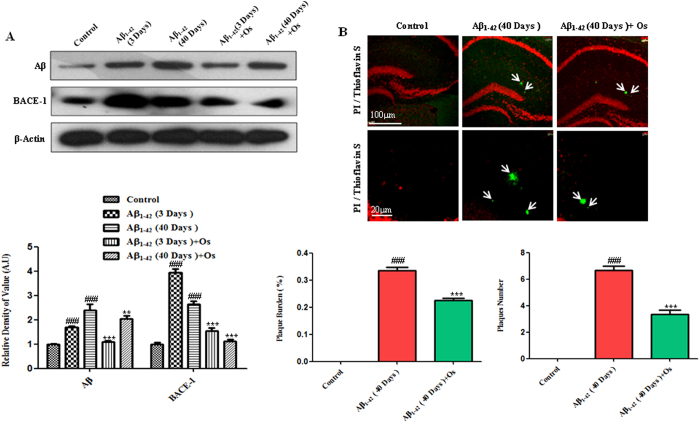
Figure 3. Osmotin attenuated the expression levels of Aβ and BACE-1.
(A) Western blot analysis of Aβ (D-11) and BACE-1 expression in the mouse hippocampus. The cropped bands were quantified using Sigma Gel software, and the differences are represented in the graphs. β-actin was used as a loading control. The density values are expressed in A.U. as the means ± SEM for the indicated proteins (n = 10 mice/group). (B) Thioflavin S staining demonstrating the formation of Aβ plaques at 40 days post-Aβ1-42 injection. Treatment with osmotin significantly reduced the plaque number and burden (%) compared with Aβ1-42 treatment alone. n = 5 mice/group, n = 3 experiment. Magnification 10x and 40x. Scale bar = 100 μm and 20 μm. #significantly different from the vehicle-treated control mice; *significantly different from the Aβ1-42-treated mice.

