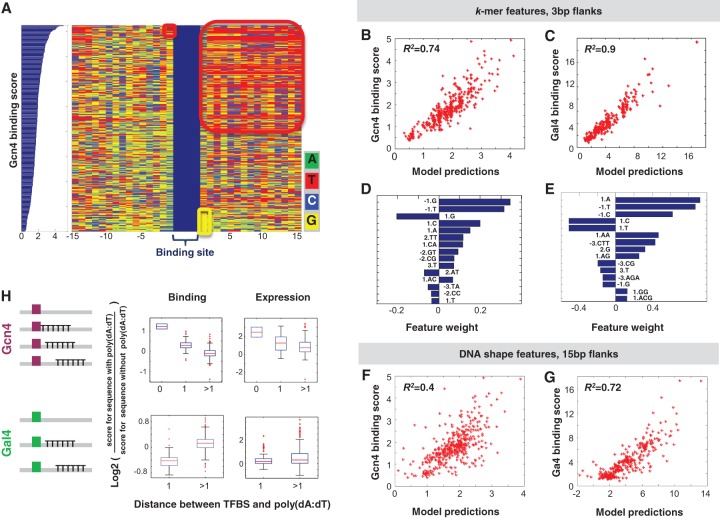
Figure 4.
Computational models based on the flanking sequences of the core TFBS successfully predict differential binding to sequences that contain the same core binding site. (A) Shown are 412 sequences that contain the same strong Gcn4 site sorted by their binding score. We show the core TFBSs (in blue) and the identity of each nucleotide (color-coded) within 15-bp flanks upstream of and downstream from the site. Examples of specific flanking sequences that are enriched among the low or high scoring sequences are highlighted by colored squares. (B) Scatter plot of Gcn4 binding scores versus model predictions, with 3-bp flanks, based on the 1mer + 2mer model. (C) Same as B but for Gal4. (D) Feature weights for the top 15 sequence features for the model in B. (E) Feature weights for the top 15 sequence features for the model in C. (F) Scatter plot of Gcn4 binding versus model predictions, with 15-bp flanks, DNA-shape-based model. DNA shape features are minor groove width, roll, propeller twist, and helix twist (Yang et al. 2014). For each of these features, the model includes a value computed per bp (minor groove width and propeller twist) or bp step (roll and helix twist) derived from a 5-bp window surrounding that bp using DNAshape (Zhou et al. 2013), a mean value across the 15-bp downstream flanks, the 15-bp upstream flanks, and the concatenated 30-bp flanks. (G) Same as F but for Gal4 binding. (H) Boxplots of log2 of the binding score (left) or expression levels (right) of sequences with 15-bp poly(dA:dT) tracts, at different distances from a strong Gcn4 or Gal4 TFBS, divided by the binding score/expression levels of the same sequence without the poly(dA:dT) tract.

