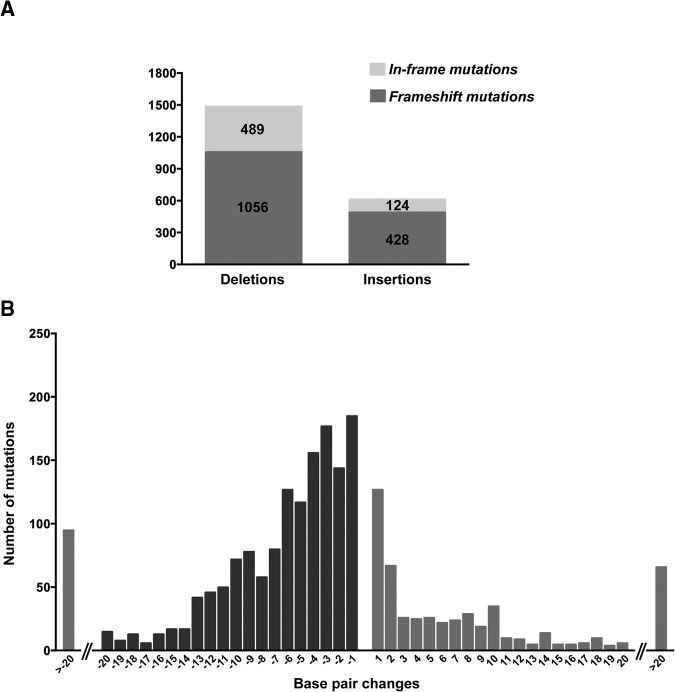
Figure 4.
Distribution of CRISPR/Cas9-induced mutations in the germline. CRISPR/Cas9 induced more deletions than insertions. Approximately two-thirds of the deletions and insertions were frameshift mutations and most likely caused gene truncations. (B) Mutations were classified according to their insertion or deletion size as determined by fluorescent PCR data. Left bars (dark gray) indicate the deletion range and right bars (light gray) indicate insertion sizes. The bars on each extreme of the x-axis indicate the total number of mutations (deletions or insertions) that are >20 bp in size. Insertions and deletions >20 bp ranged to the largest detected size of a 182-bp deletion and 52-bp insertion.

