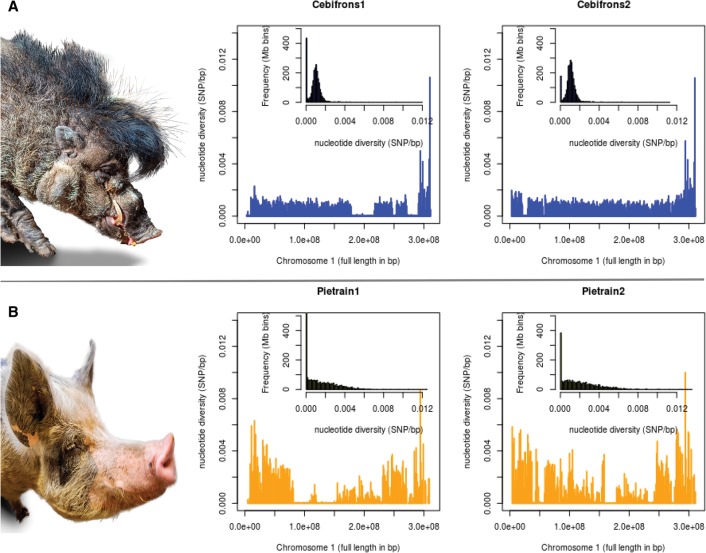
Figure 1.
Genome-wide variation in individual pigs. The nucleotide variation within the genome of two individuals for each population is displayed. In the large box, the x-axis shows the full length of Chromosome 1 in base pairs (bp), and the y-axis shows the nucleotide diversity within an individual genome in number of heterozygous sites (SNPs) per bp. Values are averaged over bins of 1 Mbp. The small histogram within each box represents the distribution of nucleotide diversity per bin of 1 Mbp for all autosomes. (A) The zoo population of Sus cebifrons. (B) The commercial Pietrain population.

