
Figure 2.
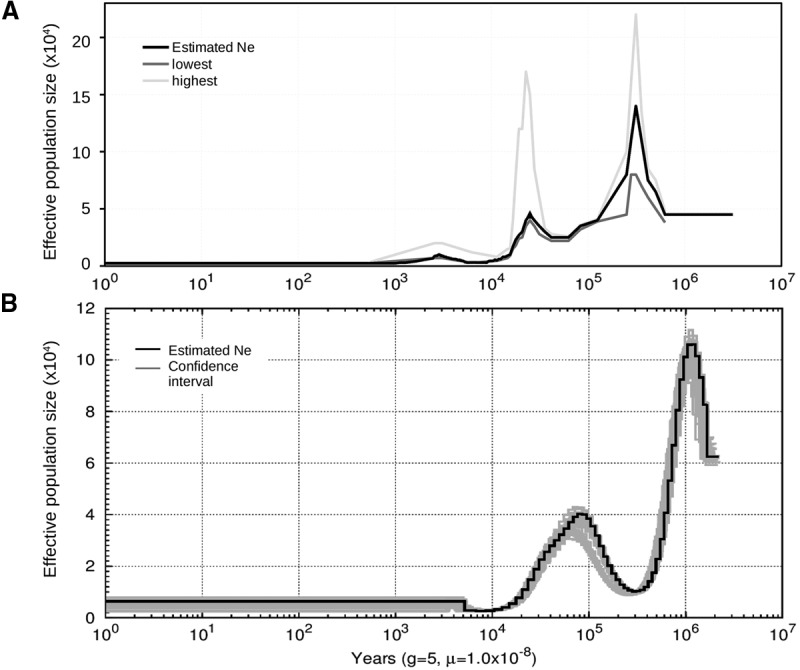
Demographic history of Sus cebifrons. Two methods were used to infer the demographic history of the wild Sus cebifrons population based on the genome sequence of one male. (A) The method by MacLeod et al. (2013). The original estimated Ne is visualized in black, and the upper and lower limits of the confidence interval are indicated. (B) The method by Li and Durbin (2011) (PSMC). The original estimated Ne values for the same individual are indicated in black, and the gray lines represent 10 bootstrap estimates for this particular individual and the other four are individuals from the same population. For both methods, the generation time was set at 5 yr, and the mutation rate at 1.0 × 10⁻⁸ and scaled for the false negative rate. The x-axis displays the time before present in years, and the y-axis displays the estimated effective population size.