
Figure 3.
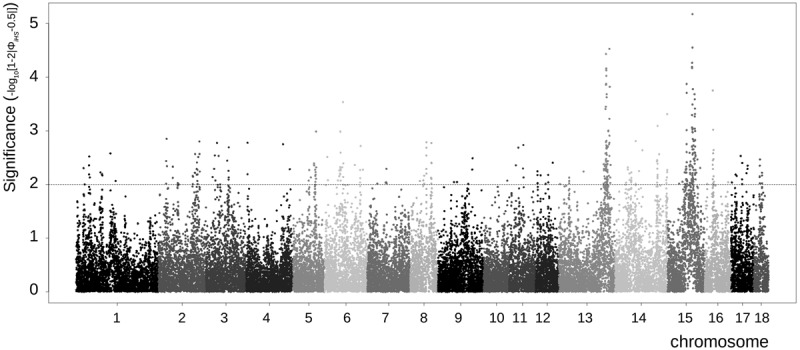
Signatures of selection in the Pietrain population. Extended haplotype homozygosity per chromosome for the Pietrain population. Values are based on the raw iHS signal before management over all chromosomes in the Pietrain population. The x-axis displays the location on all 18 autosomes, and the y-axis shows the P-value of the iHS signal before management for each marker. Values greater than 2 are considered to be significant according to Voight et al. (2006).