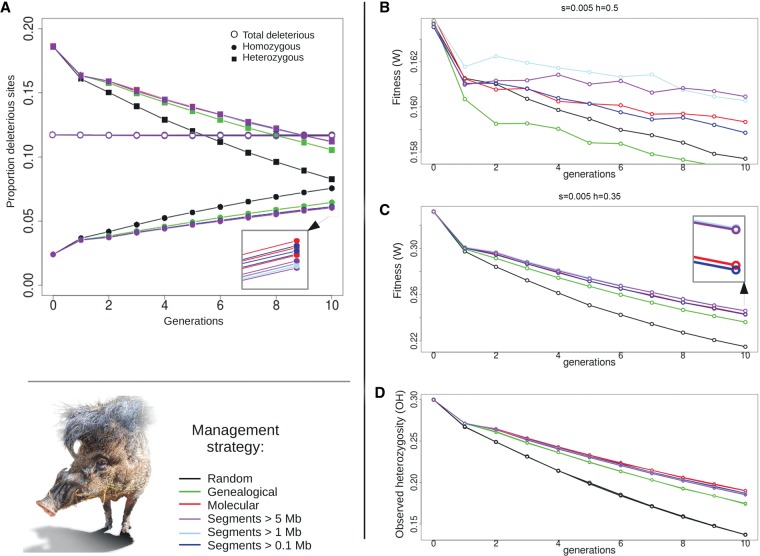
Figure 5.
Fitness and diversity during management of the S. cebifrons population. The change in fitness and observed heterozygosity (OH) during 10 generations of management is displayed for five different management strategies. (A) The proportion of deleterious sites is displayed on the y-axis and the generations are shown on the x-axis for the scenario in B (s = 0.005 and h = 0.5). Deleterious sites are split into homozygous sites (filled circles), heterozygous sites (filled squares), and the total number of deleterious sites (open circles). (B) Fitness change over 10 generations of management when a dominance coefficient of 0.5 is applied. (C) Fitness change over 10 generations of management when a dominance coefficient of 0.35 is applied. (D) Observed heterozygosity during 10 generations of management.

