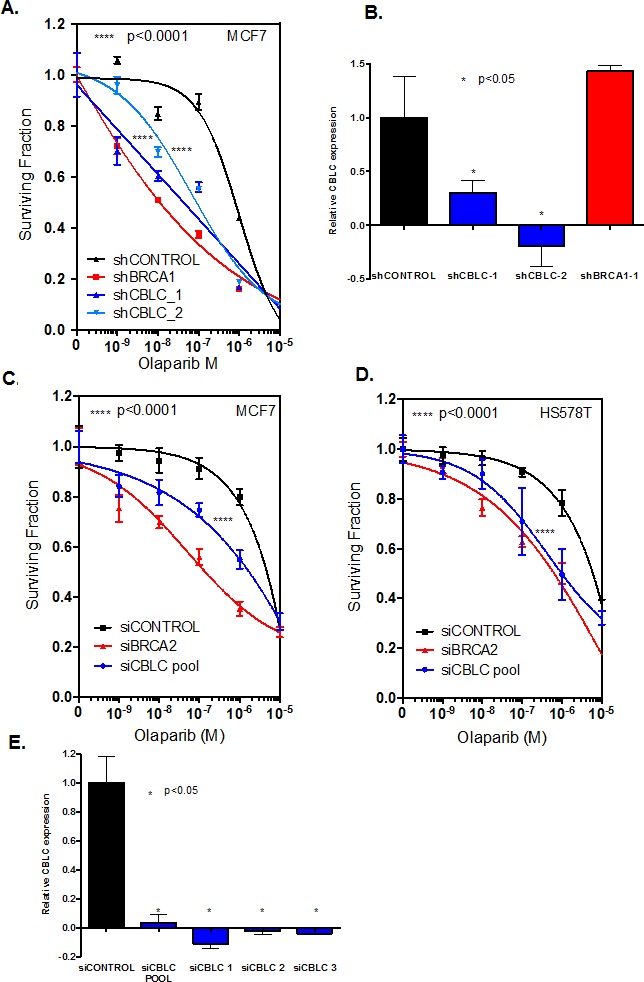
Figure 2. CBLC gene silencing causes PARP inhibitor sensitivity.

A. Clonogenic dose-response survival curves from MCF7 human breast cancer cells infected with shRNA expression constructs targeting either BRCA1 or CBLC. Transduced cells were subsequently exposed to olaparib for 14 days at which point cell colonies were counted. Two different shRNA expression constructs targeting CBLC, shCBLC_1 and shCBLC_2, were used.****ANOVA p value <0.0001 for the dose response curves in either shCBLC_1 or shCBLC_2 transduced cells vs. shCONTROL transduced cells. Data from shBRCA1 transduced cells is shown as the positive control. B. Bar chart illustrating CBLC RT-PCR data from MCF7 cells expressing CBLC cDNA and transduced with shRNA expression constructs. *Student's t test p value <0.05 for CBLC expression compared to shCONTROL tranduced cells. C. and D. Olaparib dose-response survival curves from MCF7 (C) or HS578T (D) human breast cancer cells transfected with siRNA targeting either BRCA2 or CBLC. Cells were transfected with siRNA and 48 hours later exposed to olaparib for a subsequent six days.****ANOVA p value <0.0001 for the dose response curves in siCBLC transfected cells vs. siCONTROL transfected cells. Data from siBRCA2 transfected cells is shown as the positive control. E. Bar chart illustrating CBLC RT-PCR data from MCF7 cells expressing CBLC cDNA and transfected with siRNA. * Student's t test p value <0.05 for CBLC expression compared to siCONTROL transfected cells. Where error bars are shown these represent the standard error of the mean (SEM) from three independent experiments.
