
Figure 3. Metformin (Met) decreases the ovarian tumor growth.
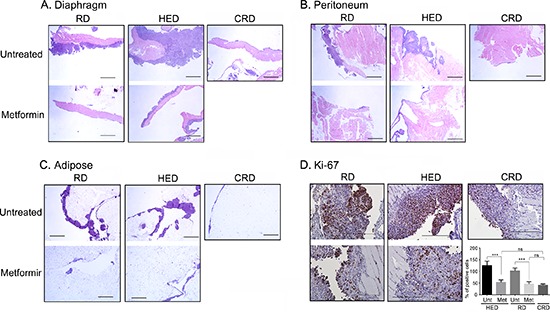
Paraffin tumor sections obtained from the peritoneum (A), diaphragm (B), peritoneum and adipose were stained with hemotoxylin and eosin and visualized under a bright-field (20x) to observe for tumor nodules. Each stained tissue picture is a representative of at least 5 individual mouse sections from each of the RD, HED, CRD and Met treated groups. (D) Representative Ki-67 staining from the ID8 tumors at the peritoneum (200x). Count of positive Ki-67 cells from 5 high powered fields (x400) in 3 different xenografts from each group is presented as bar graph. ***p < 0.001, ns = non-significant. CRD, caloric restriction diet; HED, high energy diet; RD, regular diet; Unt, untreated.