
Figure 6. Metformin (Met) induced AMPK and SIRT1.
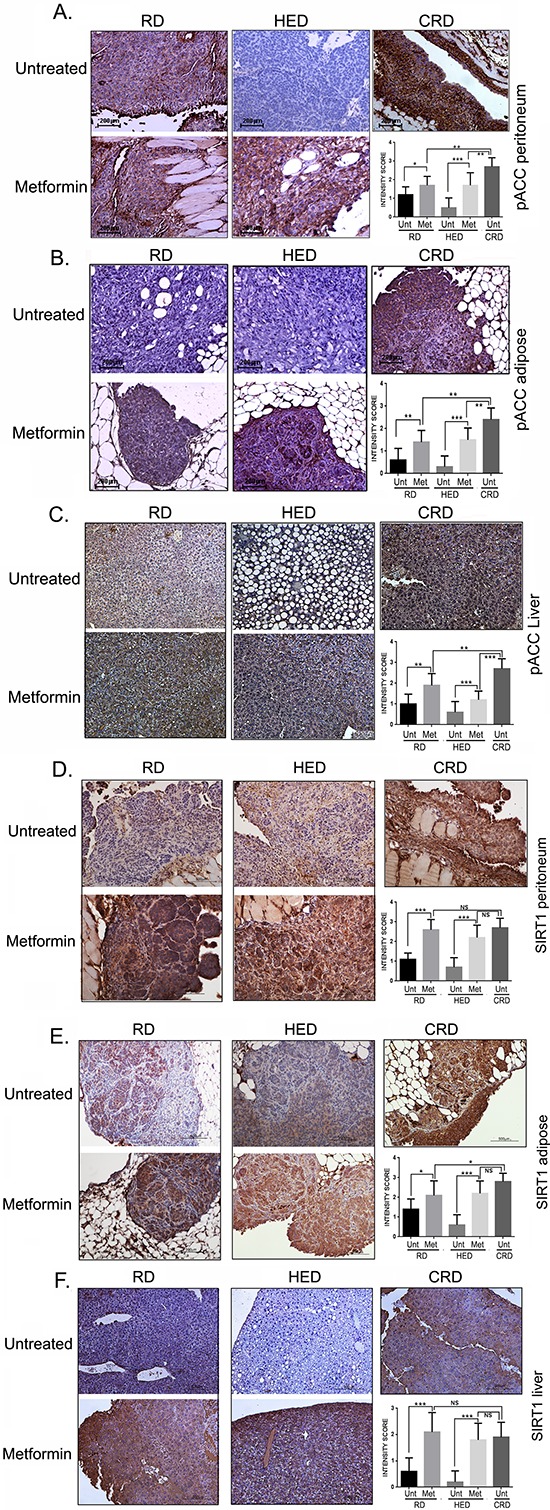
Paraffin tumor sections obtained from the peritoneum and adipose sites and liver of mice from the RD, HED, and CRD groups with and without Met treatment were immunostained with antibodies against phosphorylated acetyl-CoA carboxylase (pACC), as a marker for AMPK activation (A, B, C) and SIRT1 (D, E, F). Stains were developed using chromogen and visualized under a bright-field (200x) to observe for positive brown stain indicative of expression. Each stained tissue picture is a representative of at least 5 different fields examined per section from a minimum of 3 individual stained sections per group. Quantification of the intensity of the stain was performed on a scale of 0–3: 0–1 for no or weak stain; 2 for moderate stain and 3 for strong stain from 3 different fields of a minimum of 2 stained sections and is represented as a bar graph. ***p < 0.001, **p < 0.01, *p < 0.05, ns = non-significant. AMPK, adenosine monophosphate activated kinase; CRD, caloric restriction diet; HED, high energy diet; RD, regular diet; SIRT1, sirtuin 1; Unt, untreated.